Picture it: Texas, 1998. A young analyst pulls into the parking deck just as the sun peeks over the horizon. BlackBerry and flip phones are the latest advancements in technology; no business intelligence (BI) software or dashboards exist. It’s this analyst’s responsibility to summarize the CEO’s daily report into a single-page snapshot of the business that can be used to make sound decisions throughout the day.
That young analyst was me. The report, painstakingly assembled by hand, provided executives with a pocket-friendly portable format for their day-to-day decision-making for the company.
There’s a lot of pain in the mortgage industry right now: Rising costs per loan, low inventory and high rates are resulting in fewer loans, and we’re all still hoping that rumored refinance boom is right around the corner. Lenders who take the time to delve deeper into the data available to them will have a clearer picture of the information that can help develop strategies to manage these and future obstacles.
Good business decisions rely on good information. The more leaders know, the more likely they are to make sound decisions that will positively impact their organizations. Mortgage lending executives, particularly, should seek a 360-degree view of their companies. We’ve come a long way since the days of preparing daily written reports. Still, even with all the new technology available today, mortgage lenders must be willing to take a deeper look at the data to uncover the real insights that can drive a company forward.
At STRATMOR, we frequently see two main challenges executives face when leveraging data to help mitigate risk and innovate:
Further, without good protocols for data management and presentation, it’s much more difficult to track progress once a plan of action is chosen.
Executives struggle with these challenges throughout their careers. How can they make the best decisions, given the information they have and the time they are allocated to process it? Too often, it feels like they are working in the dark.
This article explores how lenders can make sense of their existing data, while identifying additional information needed for consistently informed decisions that drive organizational success.
Before we start, let’s address an issue that often derails conversations like these.
When Business Intelligence (BI) software was new, any discussion about big data or using data to make better decisions naturally gravitated to the software itself, rather than the valuable insights it provided. Companies installed the applications, connected their databases, and expected great results. Most of the time, those results failed to materialize.
Today, when our conversations with lenders include the use of available data and information to make better decisions, executives will often push back because they assume we are promoting software. This misses the true focus: valuable insights are a catalyst for positive change in their business.
We use various types of software and analytics that work in conjunction with excellent development partners to make certain the tools we’re using provide us with timely and accurate information, but today’s business intelligence conversation is about so much more than software.
If exercise equipment has taught us anything, it’s that the very best tools will produce no measurable benefit if they are not put to use. How many people do you know use their exercise bike as a clothing rack? No one will get any fitter unless they actually ride the bike.
Even when used, the best software can only process what’s available in the user’s database, which provides executives with only a partial view of their business — not a complete one. There are shadows that obscure important details; data that gets lost in the dark.
Some of this can be better illuminated if you analyze your data over time. Static data points are not nearly as useful as historical trend data applied to current metrics. Knowing how these numbers are changing, monthly, quarterly, and annually sheds light on the effectiveness of current operations. But even this is not enough to bring an organization’s business completely into the light.
Executives need benchmarking data from credible sources to accurately determine whether the metrics they are tracking are as good or as bad as they think they are. Historical trend analysis and peer data help pull meaningful insight from the information. This type of data adds context to a particular lender’s metrics and can show them what impact their actions have on their ability to compete.
Gaining access to this type of data and then using it to put your lending operation’s own trending performance into perspective is like donning a pair of night vision goggles. Suddenly, business details that are often missed due to poor visibility move to the forefront providing a clearer picture of the industry and your performance within it.
It’s important to put your company’s data into perspective to make sure it means what you think it means. Here’s how to get started:
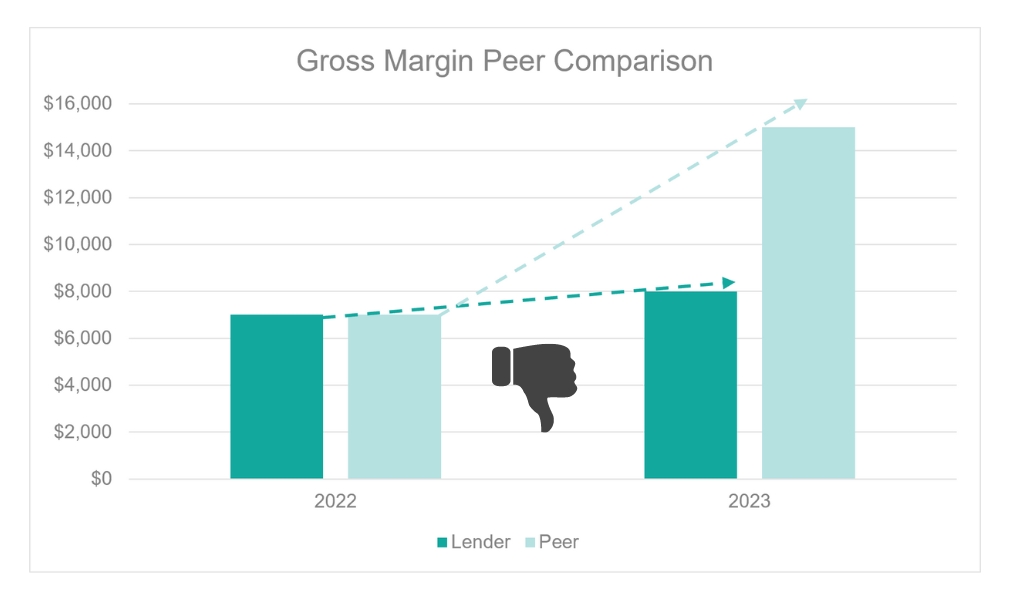
Let’s say you’re looking at profitability and your key metric is gross margin. Looking at an $8,000 margin that has risen from $7,000 the previous period may have some executives dancing in the corridors and exchanging high fives. That ends abruptly when they find out their peer is earning a $15,000 margin on the same product.
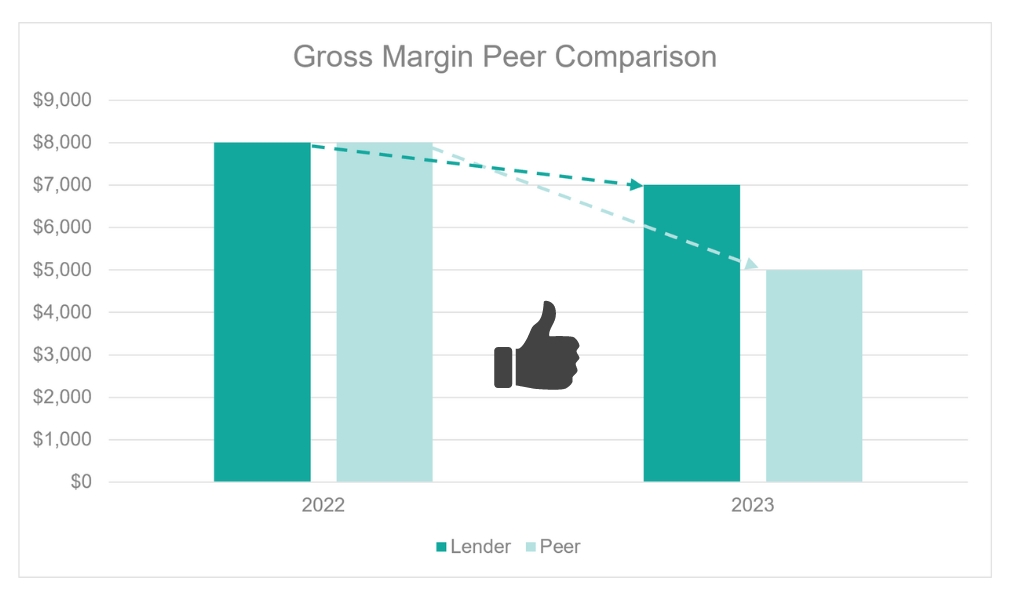
It works the other way, too. A gross margin that slips from $8,000 to $7,000 may feel like the end of the world, until you find out your closest peers are looking down the barrel of a $5,000 gross margin. Then, life doesn’t seem so bad.
But no experienced executive wants to make decisions based on how things seem. They need to know. Benchmarking is one way of providing that illumination. Historical analysis and focusing on the right metrics are two additional methods to gain this insight. Together, they chase away the shadows that obscure your view of your business so the path forward will come into focus.
Once seen clearly, mortgage executives will realize that no metric is relative (either good or bad) if it’s in a vacuum. Only when it is analyzed in light of historical trends and peer performance will it reveal its value to your organization.
Anyone who wears corrective lenses has had the experience of getting their vision tested. At a given point in the eye test, we tell the doctor that our vision through the device is perfectly clear. And then, with a single click, it comes into even better focus.
Do you really know if you are seeing the clearest possible picture of your business? In STRATMOR’s experience, lenders have to make sure they are looking at the right data with the right perspective and that nothing is obscuring their vision.
Every lender we meet focuses some attention on loan production and profitability but, in our case, we have added two categories to our analysis that aren’t always as obvious for lenders to consider. It’s our way of clicking the lenses to get a clearer view.
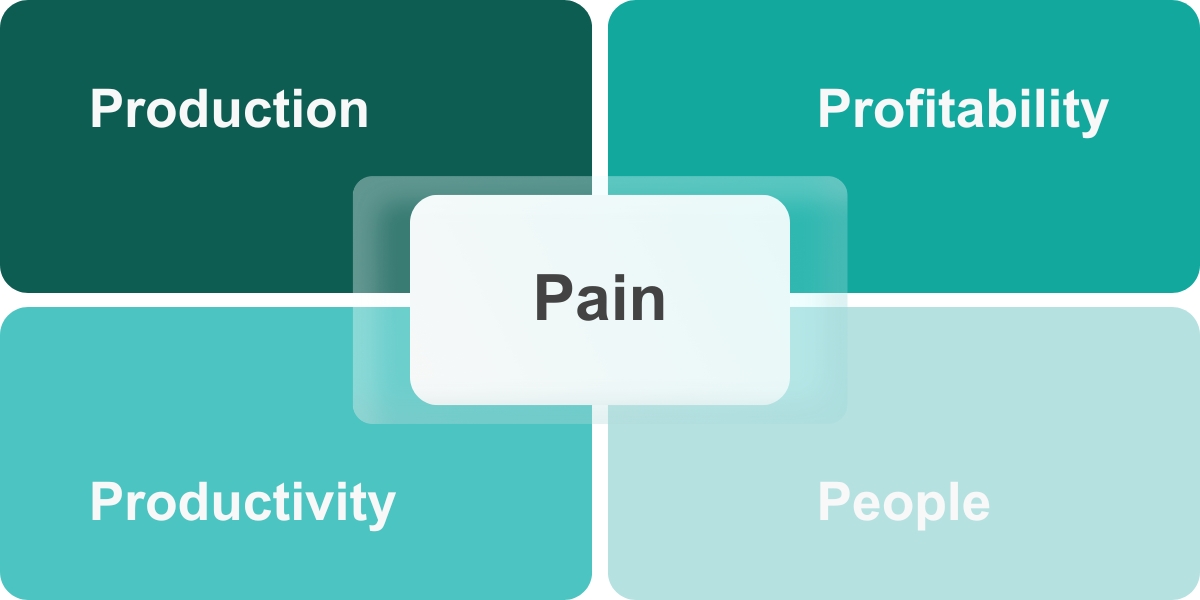
STRATMOR believes that the most critical metrics lenders should track fall into five categories:
Once all of this information is gathered, it’s time to make sense of it and share it with decision-makers to take action.
Thankfully, we’ve moved past the days of summaries created manually and formatted into quadrants of a piece of colored paper that could be folded to fit into the executive’s suit jacket like a pocket square. We’ve come a very long way since then. But we still need to make it easy for decision-makers to access the information they need to drive their organizations.
Each company must decide what information is important enough to make it onto that summary, ensure its accuracy, and provide timely and actionable insights. Fortunately, new technology is now making the process easier than ever.
Presentation is key. Hiring a new director of lending and then burying them under a pile of old reports won’t help them get up to speed quickly. At the same time, providing a summary report without the detail to tell the story behind the numbers won’t support good decisions and cannot empower a new executive to innovate.
It’s important to find a way to present the right information in the right format to allow an executive to focus where it makes the most sense, uncover problems and opportunities, and make the best decisions.
So, how does that work, exactly?
Our advisors had ideas about this and so we engaged an excellent partner to test our theories in an area of the business we have long been passionate about.
STRATMOR’s MortgageCX (MCX) service has been very well received by the industry because it focuses on the people, both inside and outside the company, that our lenders rely upon. By tracking metrics like Net Promoter Score (NPS) and borrower satisfaction (CSAT), our MCX offering has put this complex part of the lender’s business into perspective and offers leadership teams the chance to benchmark findings against peer lenders.
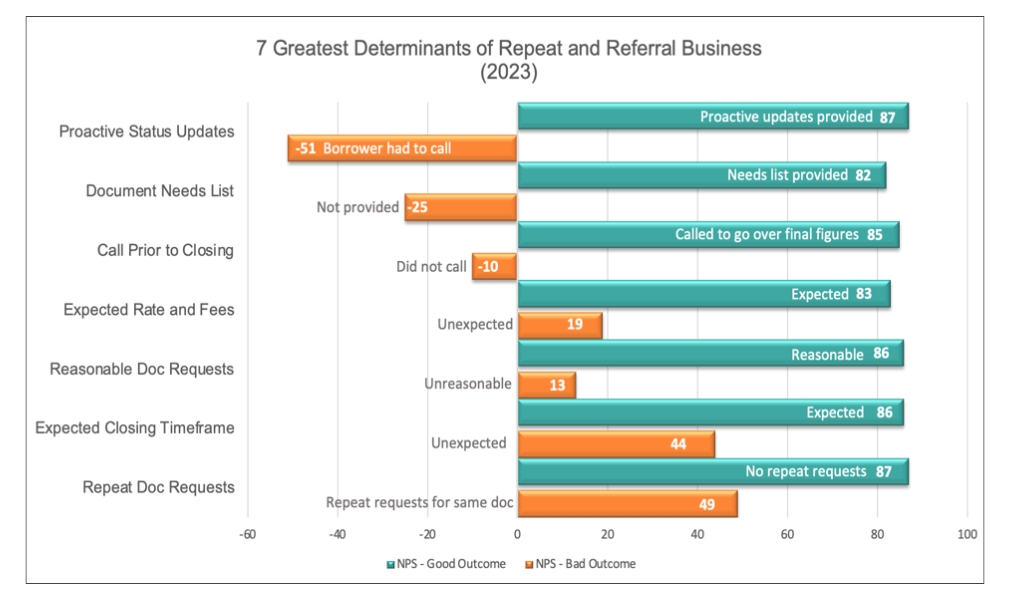
We’ve used data gathered through our MCX program to identify the seven greatest determinants of repeat and referral business, or what we often refer to as the “Seven Commandments.” We score our MCX clients in each of these areas to show where improvements can be made in their process.
But could it be even better? To find out, we partnered with Teraverde® to use its Coheus® platform, a tool that provides the ability to quickly visualize the key metrics and easily drill into those metrics to uncover the deeper insights.
The MCX data delivered through Coheus allows lenders to access that 360-degree view of their customer satisfaction results. The first dashboards show their company findings compared to the national benchmark. While that “single sheet of paper” view is the first step to understanding the business, the Coheus tool will also allow lenders to drill down on areas of interest to formulate action plans.
“Many lenders need a way to break the cycle of quarterly losses. Customer experience must be superior. MCX provides the factual voice of the customer to ensure every borrower is completely satisfied, and every financeable loan closes,” said Maylin Casanueva, President of Teraverde and innovator of the Coheus platform.
“With the new visualization tools, STRATMOR’s MCX team can help lenders visualize exactly what the journey looks like for their borrowers. They can identify touchpoints and gaps and track the experience throughout the process,” Casanueva said.
The point is to see if the tool will make it easier for executives to overcome the two challenges we identified at the beginning of our article. Can they quickly see the state of their business, and, more importantly, can they make sense of the data that is flowing through their processes and use it to make informed business decisions?
“Most executives are busy people and have a narrow bandwidth for new information. To capture and hold their interest, data must be curated to be both highly relevant and immediately actionable,” said STRATMOR Customer Experience Director Mike Seminari. “What Coheus has done is make the executive summary concept interactive. Instead of reading endless rows of static numbers, executives can notice an anomaly (e.g., a region with a low NPS score), and then drill down to the branch or LO or processor where the problem is rooted. Or they can identify a specific process issue that is persisting through one or more of those levels. STRATMOR learned long ago that visibility and the personalization of customer experience results are the one-two punch that changes company culture. Coheus is giving us the opportunity to level up in both of those areas.”
Data visualization tools are valuable because they not only alert executives to potential problems but also provide evidence of successful troubleshooting.
Executives need to pinpoint what’s not working and exactly where it’s not working.
Ask the following questions when determining which areas need your attention first:
Once the most pressing issue or issues have been identified, a course of action to resolve the problem can be plotted.
As I cited in the opening of this article, there’s a lot of pain in the mortgage industry right now. Lenders need clearer vision and better illumination to develop impactful strategies to drive success.
STRATMOR advisors are ready to help you make sense of the deeper insights waiting to be mined by your teams. We’ll collaborate with you to develop a plan that leverages this information for real, results-driven change. Nicole Yung
STRATMOR works with bank-owned, independent and credit union mortgage lenders, and their industry vendors, on strategies to solve complex challenges, streamline operations, improve profitability and accelerate growth. To discuss your mortgage business needs, please Contact Us.


Feel free to reach out with any questions or needs we might be able to help with.