The popular, Emmy-Nominated TV show MythBusters was a weekly documentary in which two Hollywood special effects experts attempted to debunk urban legends by directly testing them. One of the top-ranked episodes, “Duct Tape Island,” dropped these experts onto an island armed with nothing but duct tape. Their mission was to use it to source water, find food, build a shelter and get off the island.
In the “Duct Tape Island” episode, Jamie Hyneman and Adam Savage confirmed that:
And, if you can’t find the keys to your teenager’s car, it’s good to know you can use duct tape to move that car out of the way (in the follow-on episode,” Duct Tape Hour,” they lifted a 5,000-pound car).
Unlike the confirmed findings of the MythBusters duct tape experts where the myths were, in fact, true, STRATMOR believes that some of the commonly-held “facts” in our mortgage industry are truly myths that need to be debunked.
In this article, we will use STRATMOR’s data and decades of industry experience to prove or dispel these myths:
It is important to note that we are focusing on the distributed Retail channel only in this article. STRATMOR believes that there are economies of scale in the Broker Wholesale and Correspondent channels. We believe there are potential economies of scale in Consumer Direct depending on the level of brand awareness and the ability to leverage customer relationships and data.
Conventional wisdom suggests that as Retail lenders grow, the cost to originate declines due to economies of scale. I have heard this many times in my 35+ years in the mortgage industry, and to be perfectly honest, I have made this claim myself more than a few times through the years. The phrase “economies of scale” simply rolls off the tongue and just seems to make sense. But is this true?
For this purpose, we are utilizing data from the MBA and STRATMOR Peer Group Roundtables (PGR) program. The PGR program is an industry benchmarking program which has been jointly conducted by the Mortgage Bankers Association and STRATMOR Group since 1998. To test this hypothesis, we selected PGR cost data for a “repeater” company population of banks and non-banks for the last four years (2015-2018). Table 1 below summarizes what we found across four major cost categories for independent (non-bank) lenders.
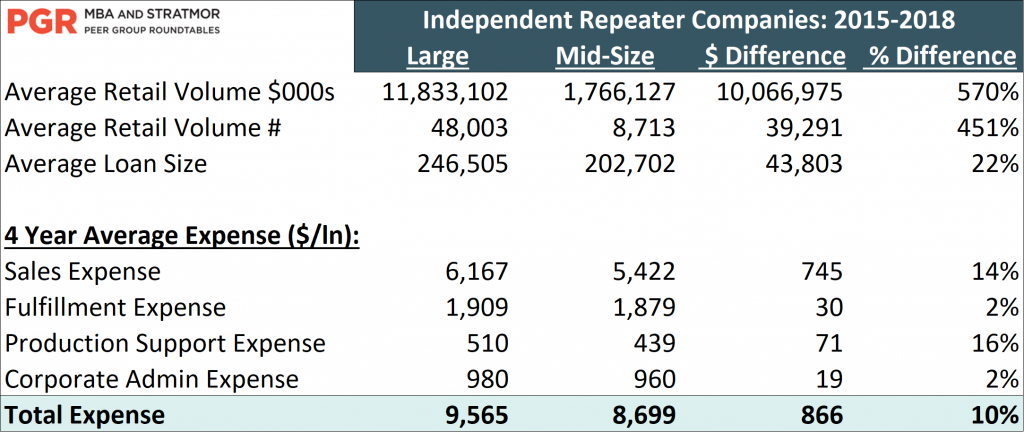
Note that the large lender category averaged $11.8b or 48,003 units of annual volume which was larger than the mid-size category by a factor of 4.5 to 5.7x. Surely Retail lenders in the large lender category should reflect lower costs due to economies of scale, right?
Not so fast. Large lenders’ average total cost for the four-year period was $9,565/loan which was 10 percent higher than the mid-size group. Even when accounting for the higher sales cost related to the higher average loan size for the large independents, the larger independents still show higher costs. While the fulfillment and corporate administration categories were in the same ballpark, large lender costs still exceeded mid-size lenders by two percent in those categories.
We conducted a similar analysis for large and mid-size banks shown in Table 2 below.
Table 2
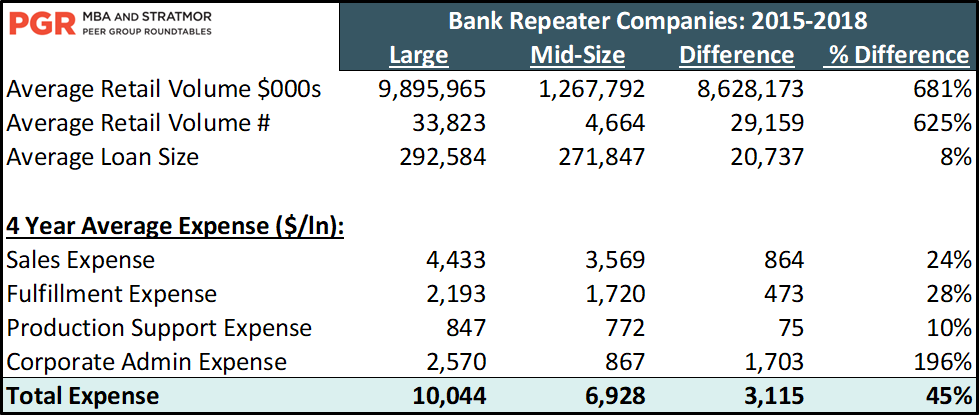
Note that large bank volume exceeded mid-size by a factor of 6x to 7x. Like the independent repeater population, large banks do not appear to enjoy any benefits from scale. Quite the opposite — there appears to be diseconomies of scale for large banks, as total expenses of $10,044/loan exceeded mid-size bank expenses by $3,115/loan or 45 percent over the four-year period. Some would argue that corporate administration expense for large banks is often inflated by large allocations of expense from the parent bank. There is a certain amount of truth to that. However, even if we cut corporate administration in half to $1,285/loan, that would still exceed the mid-size bank average by $418/loan or 48 percent. And, it is not as if the mid-size banks don’t have parent allocations of their own which they could argue inflate their corporate administration costs.
STRATMOR believes that there are a variety of factors that explain why achieving economies of scale in retail lending has been an elusive goal.
Economies of scale is a proven business principle — bigger is usually better especially as an industry matures. But in the complex world of distributed retail mortgage lending, large lenders, on average, have not been able to achieve scale economies.
In the future, it is possible that the industry may make some progress on this front. With the ongoing development and adoption of digital tools, RPAs, AI and the like, perhaps we have a fighting chance to achieve scale economies in the Retail channel. But for now, bigger is not necessarily better.
Now this is just common sense. Isn’t it much easier and more efficient to allocate resources and “load balance” in a centralized model? Wouldn’t the adoption and enforcement of more standardized processes result in lower costs? And surely the ability to tightly manage a group of employees in one location must result in lower costs, right? Guess again.
Once again, we are utilizing data from the PGR program to debunk this myth. Table 3 below summarizes key fulfillment metrics for the same population of repeater independent mortgage bankers referenced above.
Table 3
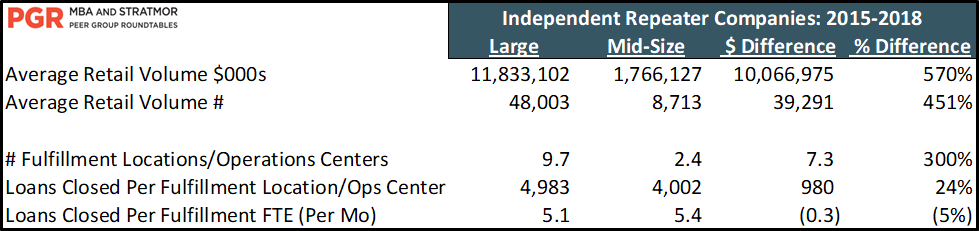
Let’s start with the basics. As one might expect, large lenders are somewhat more regionalized than the mid-size group and reflect greater average throughput per location (4,983 loans vs 4,002 or 24 percent higher). Does this greater throughput result in better productivity? No, as large independents average 5.1 loans closed per fulfillment FTE versus 5.4 for mid-size lenders.
A more centralized model does not seem to result in improved productivity for banks either, as shown in Table 4 below.
Table 4
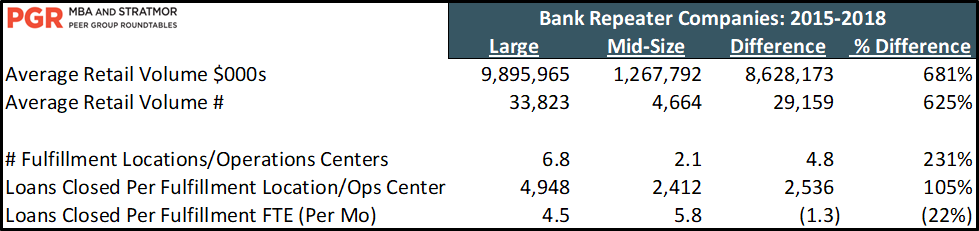
The lack of pick up in productivity through centralization is even more pronounced for large banks. Large banks averaged 4,948 loans per fulfillment location which was over twice as high as mid-size banks at 2,412 per location. While one would think this tremendous difference in throughput would result in higher productivity, the opposite is true. Large banks averaged 4.5 loans per fulfillment FTE per month which was 22 percent lower than the 5.8 loan average for mid-size banks.
Because execution matters more than location. Costs are driven by the interaction of people, process and systems. Employing well-trained and knowledgeable people to fulfill loans using an efficient process and workflow enabled by the smart use of technology will result in higher than average productivity and lower than average costs. It matters less where the people are sitting than how efficiently they are working.
In fact, the concept of centralization is not as relevant in the modern era of mortgage banking as a large percentage of fulfilment employees now work remotely in a paperless environment. For example, based on recent conversations with lenders, STRATMOR believes that well over half of all underwriters work from home on a regular basis. If we assume that large and mid-size lenders allow for remote employees to a similar extent, what then is driving the higher costs for more centralized models?
Large lender costs are higher not because they tend to be more centralized — it has more to do with the factors cited above in the economies of scale discussion, such as high growth, increased complexity due to number of states, increased regulatory scrutiny, bureaucracy, etc. Having higher throughput per fulfillment location is not enough to overcome these factors. In fact, throughput per location is less relevant in today’s digital environment.
As the depth, breadth and pace of technological change accelerates, one might assume that, on average, older borrowers are less tech savvy and have trouble keeping up. If we are to believe what we see on TV sitcoms, we live in a world where our pre-teen children seem to run circles around middle-aged to older adults. When it comes to mortgage lending, surely the older folks (I should be careful here because many would put me in that category) are getting blown out of the water by technology.
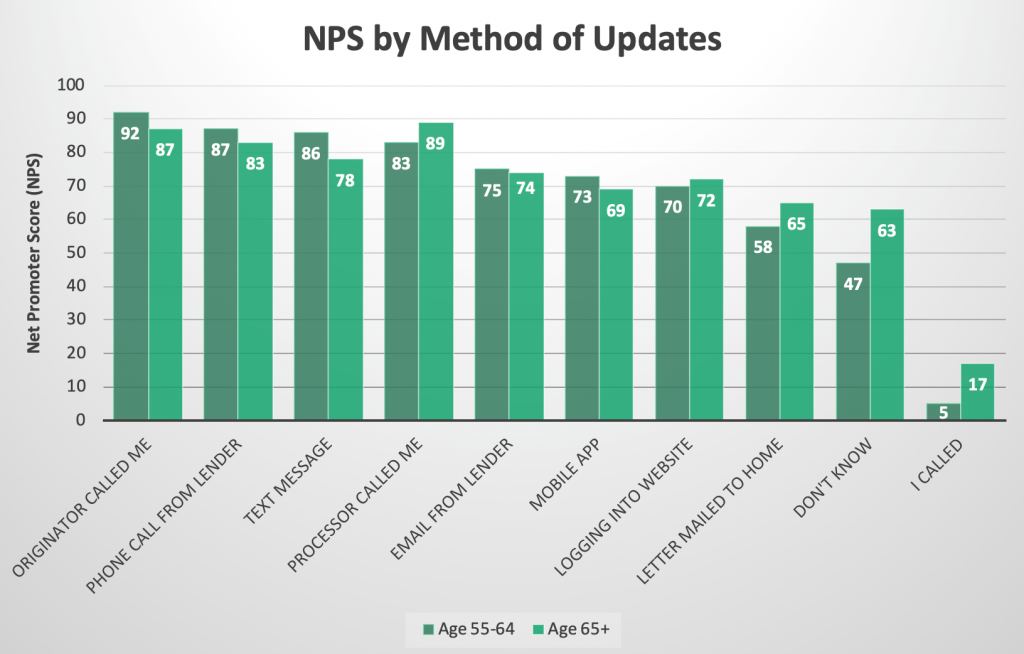
To debunk this myth, we are using data from STRATMOR’s MortgageSAT borrower satisfaction survey program. In this program, borrowers from participating lenders fill out a detailed survey on the web (response rates are typically in the 35-40 percent range) while lenders upload pertinent loan information to our data portal. This generates incredible data on what drives satisfaction, and participating lenders can benchmark satisfaction across a variety of dimensions (e.g. versus peers, by product, by location, by employee, etc.) The data also includes a Net Promoter Score (NPS) for each borrower response. Last year alone, STRATMOR received more than 115,000 borrower responses, and we have received more than 500,000 responses to date.
So, what does the data reveal about older borrowers? Here are some key data points:
Chart 5
For this myth, explaining the “why” is more challenging. A couple of key factors come to mind:
Older borrowers are generally more comfortable with the loan transaction. Think about it —many or most seniors have been “trained” by many refinance transactions in the declining rate environment for the past 30 years. Based on that, they are more likely to use digital tools, especially with a refinance transaction. Why would a senior feel the need to deal directly with their loan officer on their sixth refinance?
Seniors continue to move up the technology curve just by living in today’s society. For me and many other older Americans, to keep the lines of communication open with children and younger adults, we communicate through the media they are actively using. Heaven forbid if you leave your teenage child a voice mail versus a quick text! Snail mail is not even on the table except for special occasions. So common sense suggests that the tech gap is narrowing.
General research (non-mortgage specific) also supports the notion that older Americans adoption of digital tools is higher than one might think.
According to a Pew Research Center report on Internet & Technology published on May 17, 2017, while there is still a gap between older and younger adults, tech adoption for seniors is climbing. For example, 42 percent of adults over 65 report owning a smartphone, up from just 18 percent in 2013. Also, internet use among seniors has increased from 14 percent in early 2000 to over 67 percent today. As the article notes, the key drivers of tech adoption are age, household income and educational attainment.
Take smartphone ownership for example:
What does this mean for the mortgage industry? Home buyers and mortgage refinance customers in the senior adult category are more likely to be younger, more educated and have a higher household income. The senior technology gap is less significant than is generally assumed and it’s becoming narrower with each passing year.
At STRATMOR, we pride ourselves on being trusted advisors to the mortgage industry. Wherever possible, we try to see where the data leads us and transform that data into knowledge to help our clients make good strategic and tactical decisions that build shareholder value over time. In our industry, we continue to encounter a variety of misconceptions and commonly held beliefs which are false. If you are a Retail lender struggling with the idea of the economies of scale, centralized fulfillment operations or with the tools needed to understand borrower segments, contact STRATMOR today for assistance. Running a mortgage business is hard enough — let’s at least start with the facts. Cameron
STRATMOR works with bank-owned, independent and credit union mortgage lenders, and their industry vendors, on strategies to solve complex challenges, streamline operations, improve profitability and accelerate growth. To discuss your mortgage business needs, please Contact Us.
Feel free to reach out with any questions or needs we might be able to help with.