I spoke with a mortgage banking executive recently and asked how his company was organized from a retail branch perspective. He said, “We are a P&L branch model company.” While we all know what a P&L is, it did not really answer my question, so I asked some follow up questions. “Is the branch manager paid a percentage of the bottom line in addition to salary, overrides and commissions on personal production? Or, is the structure more of an Expense Management Branch (EMB) where the branch manager is paid the residual bottom line after the receipt of a fixed revenue credit, payment of all expenses, fees to the parent and after holding back reserves?”
The executive replied, “Oh, it is the latter — that’s what we do. It’s the best model because we can recruit excellent branches with entrepreneurial branch managers. While we give up some upside profits in good times, we find our managers do a great job of managing expenses in down markets because it directly impacts their compensation. Year in and year out, our P&L branches are more profitable.”
At STRATMOR, this was not the first time we have heard that EMB models are more profitable. But are they really? What does the data tell us? In this article, we examine the key characteristics of EMBs, their prevalence among Independent Mortgage Bankers (IMBs) versus depositories, and we compare key performance metrics between EMB model companies and “corporate” branch model companies.
The EMB model has some similarities to the old “net branch” model (wait, does anyone really use the term “net branch” anymore?). “Net branch” has a negative connotation and the structure has somewhat of a checkered past in mortgage banking history. While we are not attorneys at STRATMOR, and at the risk of oversimplifying, here is a bit of history.
In the old days, originators could use net branch arrangements to effectively “rent” a license. For example, let’s say a branch manager wanted to originate FHA loans but was not approved with HUD. The manager would seek out a HUD licensee and become a “net branch” of the lender. The lease would be in the name of the branch manager, the employees would continue to be employed by an entity controlled by the branch manager, all branch assets would continue to be acquired by and be held in the name of the branch manager, and the branch manager would be paid the net bottom line after payment of fees to the parent/HUD licensee. In substance, the branch continued to operate as it was before, but was paying a fee to “rent” the license which was clearly a violation of HUD rules.
But the wild west of net branch arrangements went away years ago. Now, executives with net branch companies (called EMBs) operate EMB branches the same as corporate branches in every aspect except for how the branch manager is paid. All branch employees are employees of the company, the lease is in the name of the licensed lender/parent, assets are held in the name of the lender, and the branch is subject to the same QC and compliance guidelines and audits.
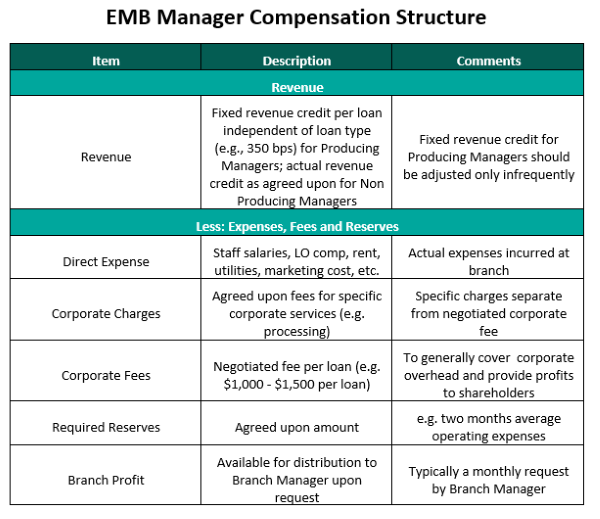
EMB company executives describe their model using labels such as P&L branches, partner branches, or Expense Management Branches. The Expense Management Branch descriptor is often used because Producing Branch Managers cannot be paid on the actual profits of the branch to avoid the risk of steering borrowers into higher cost loans that are not in the borrower’s best interest. So, the branch receives a fixed P&L credit (e.g., 350 bps) per loan which does not vary based on loan product (more on that below) and is only adjusted once or twice a year. Since the revenue is fixed, the branch manager is focused on Expense Management, thus the name. For purposes of this article, we will hereinafter use the term “Expense Management Branch” or “EMB” to describe this branch model.
The table below summarizes the typical compensation structure for branch managers under an EMB arrangement.
Table 1
 Source: © Copyright STRATMOR Group, 2021.
As discussed above, Producing Branch Manager P&Ls receive a fixed revenue credit that is independent of loan type. In this example, the branch is credited with 350 bps of revenue whether the loan is Conventional, FHA, VA, Jumbo, etc.
Next, expenses, fees and reserves are subtracted. Direct expenses include loan officer (LO) compensation, staff salaries, rent, utilities, marketing costs, etc. Corporate charges are intended to reimburse the company for specific services rendered. For example, the corporate entity may provide centralized processing or underwriting services and may charge the branch on a per loan basis. Corporate fees represent a negotiated amount that is intended to cover corporate overhead and support charges not specifically billed and to provide a return to shareholders. EMBs are also required to maintain reserves of a specified dollar amount such as two months average operating expenses. This provides a cushion for the lender should the branch begin to experience losses. The fixed revenue credit less expenses, fees and reserves equal the calculated Branch Profit which is available to be distributed to the branch manager upon request. The amount distributed to branch managers each month may vary greatly, and the corporate parent is somewhat indifferent as long as the branch reserves are maintained and earnings remain strong. It is important to note that Branch Profits as summarized above are from the branch manager compensation perspective only. Actual corporate profits are different in that they would include all additional corporate revenue as well as additional support and administration expenses and would not include deductions for branch reserves.
The branch manager compensation structure for Non-Producing Branch Managers is identical to the Producing Branch Manager structure with one major exception. Non-Producing Branch Managers can be paid on the actual profits of the branch. In that case, the actual revenues of the branch (as defined and agreed to by the parties) are credited to the P&L, and the revenues may vary by loan type. While the specific revenue credits, direct expenses and corporate charges and fees may vary, the skeletal structure summarized above is fundamentally the same for all EMB model companies.
Since 1998, the Mortgage Bankers Association (MBA) and STRATMOR Group have jointly conducted the PGR: MBA and STRATMOR Peer Group Roundtable Program. This program currently includes over 100 lenders that are divided into seven peer groups and five separate and distinct datasets based on size and operating model.
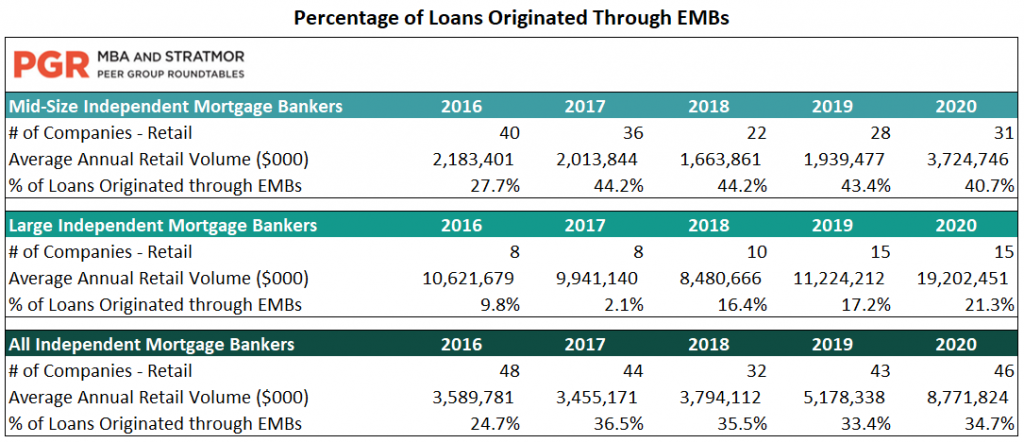
PGR participating companies report the number of branches that are structured as either Expense Management Branches or Corporate Branches and the origination volumes that flow through each branch category. Table 2 below summarizes the results.
Table 2
 Source: PGR: MBA and STRATMOR Peer Group Roundtable Program, 2021.
 For Mid-Size IMBs, the average percentage of loans originated through EMBs has ranged from 41% to 44% for the last four years. For Large Independent Lenders, after dropping in 2017, the average EMB volume has increased the last four years to 21% of total retail volume in 2020. The average EMB volume for all IMBs (Mid-Size and Large) ranged from 33% to 36% for the past four years, or about one out of every three retail loans.
While EMBs are a very common structure for IMB retailers, it is far less common for depositories to utilize this structure. The handful of depositories that offer EMB structures tend to operate a hybrid model in which the mortgage division or subsidiary operates essentially as an independent (similar LO compensation, no referrals from bank, standalone mortgage sales offices, little or no portfolio lending, etc.).
Why don’t banks typically operate with an EMB structure? In our discussions with banks over the years, we believe the primary reasons for this are as follows:
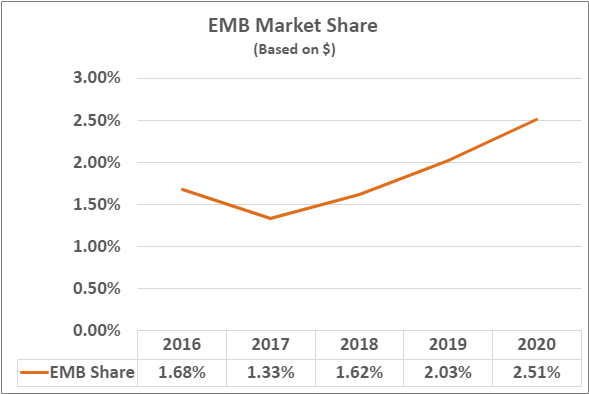
To answer this question, we compared the total production dollar volumes for a “repeater” population of PGR lenders that reported over 50% EMB volumes with national production volumes as reported by the MBA. The results are shown below.
Table 3
 Source: © Copyright STRATMOR Group, 2021.
After a drop in 2017, the EMBs have steadily gained market share through 2020. It is important to note that the market share percentages above are related to a limited population of repeater PGR companies and are not intended to represent the industry-wide market share of EMBs. Also, the denominator (national volume) includes production from the Broker Wholesale and Consumer Direct channels. Our focus for this purpose is on the market share trend line that appears to be favorable for EMBs. Based on Table 3 above, this increase in market share appears to be driven by rapid growth of certain Large Independent retailers that utilize the EMB structure.
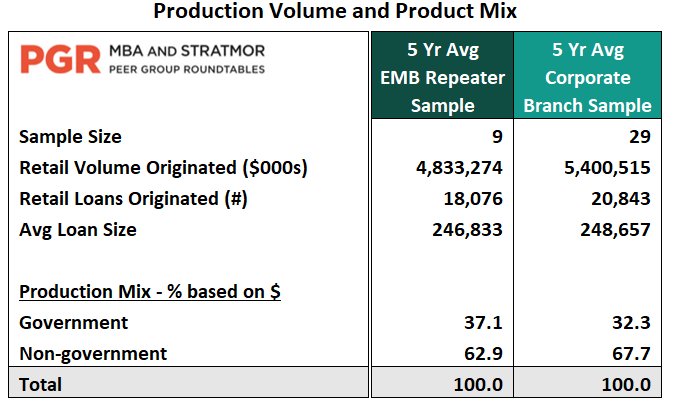
While it is clear that EMB model companies are very common with IMBs and appear to be gaining share, are they more profitable? To better understand the relative performance of the two branch models, STRATMOR performed an analysis of PGR data for the past five years (2016-2020). We selected a “repeater” population of lenders that reported over 50% Expense Management Branch volumes and compared financial and operating performance with a population of corporate (non-EMB) branch lenders. The production volumes and mix are shown below.
Table 4
 Source: PGR: MBA and STRATMOR Peer Group Roundtable Program, 2021.
 The average volumes between the two populations are very similar at about $5 billion and 20,000 units, and average loan sizes are approximately equal. The only notable difference in product mix is that EMB government volume was approximately five percentage points higher than corporate branch models. This has implications for revenue that we will discuss further below.
The Retail Channel Income Summary comparison is shown below.
Table 5
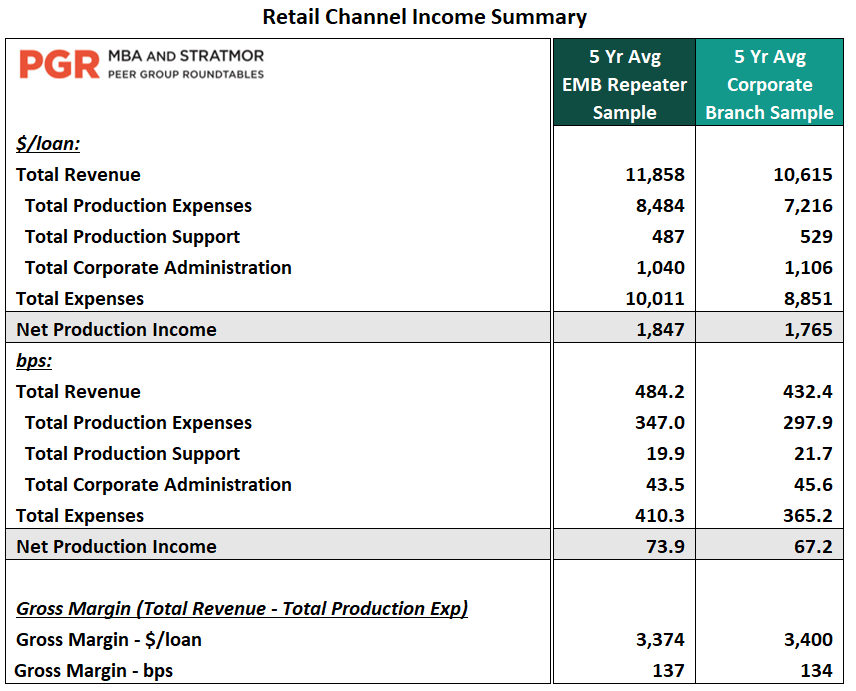 Source: PGR: MBA and STRATMOR Peer Group Roundtable Program, 2021.
 Based on the PGR data, EMB Revenues are about 52 bps higher on average. EMB Total Production Expenses (Sales and Fulfillment) are higher as well (about 49 bps on average). EMB Support and Corporate Administration costs are slightly lower. In terms of Gross Margin, defined as Total Revenue less Total Production Expenses (excluding Support and Admin costs), EMBs are approximately equal to corporate branch peers at 137 bps. Here is the punchline — while EMBs tend to have higher costs and revenues, the average Net Production Income is only 7 bps higher than corporate branch model peers and Gross Margin is nearly identical.
What might explain the higher average revenue for EMBs? As discussed above, the EMB Government mix is approximately five percentage points higher than corporate branch peers and is certainly a material contributing factor. It is also likely that EMB branch managers are more disciplined in holding the line on pricing and have the mindset of selling value and service, not price. As a result, EMBs earn more revenue per loan, but this also results in lower average branch size and loan officer productivity as we discuss below. Put another way, EMBs operate a “Nordstrom” model (higher price but lower volume) as opposed to a “Walmart” model (lower price and higher volume).
What is the story on expenses? Why are EMB costs higher? Of the 49 bps difference in Total Production Expenses, about 40 bps is due to higher sales costs (mostly commissions and bonuses) and about 9 bps is due to higher fulfillment costs (Processing, UW and Closing). EMBs have slightly lower application pull through (by 2-3 percentage points) which is likely a contributor to higher fulfillment costs. For EMBs, more revenue is coming in the front door per transaction, but this extra revenue is offset by an almost equal amount of expense that is going out the back door primarily driven by higher sales cost.
The table below summarizes average volumes per branch.
Table 6
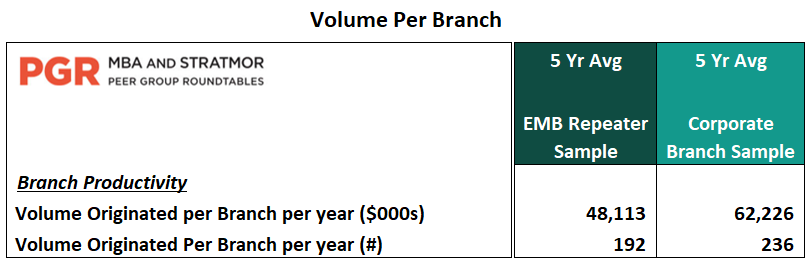 Source: PGR: MBA and STRATMOR Peer Group Roundtable Program, 2021.
 EMBs tend to have smaller branches (19% lower in units) which begs the question, why might that be? In our view, the primary driver of this is the EMBs focus on value and service (Nordstrom model) as opposed to price. Thus, fewer transactions but more revenue per transaction as discussed above. Also, EMB branch managers are often very high personal producers, and are less focused on hiring and mentoring additional loan officers. The corporate parent does not necessarily actively push the EMB to grow as long as the company continues to earn fees from the branch and manages the risks appropriately. If the EMB managers are meeting their financial goals and the corporate parent continues to earn their fees while the day-to-day management of the branch is handled by the branch manager, all is well, no harm, no foul.
The table below summarizes Loan Officer Productivity (which includes Producing Branch Managers).
Table 7
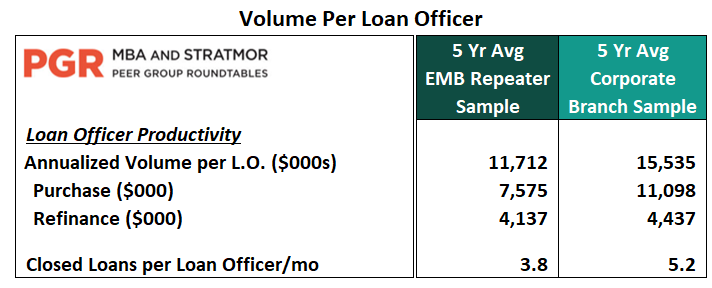 Source: PGR: MBA and STRATMOR Peer Group Roundtable Program, 2021.
 EMB loan officers averaged only 3.8 closed loans per month over the five-year period as compared to 5.2 closed loans a month for Corporate Branch peers (27% lower). One factor is the focus on value and service versus price which limits the number of transactions that are closed per month. But also, in our experience, it is more likely that EMB managers will keep lower producers on staff (friends and family plan), with less formal adherence to minimum volume thresholds. The corporate parent is typically indifferent as the extra management burden and employee benefits cost falls on the branch managers in the form of reduced compensation. Of course, this is fine as long as the branch remains profitable with strong reserves and continues to make their payments to corporate.
One interesting thing to note is that EMBs have fewer Loan Officer Assistants on staff than corporate branch model companies. This is likely because EMBs are not playing the volume game and simply don’t need the extra layer of support.
While LO turnover is a long-term industry challenge, EMBs have averaged 40% turnover for the past five years, which is five percentage points higher than Corporate Branch lenders as shown below.
Table 8
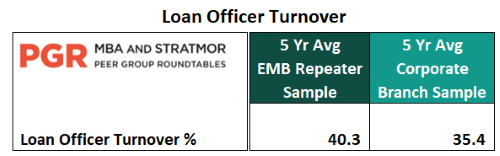 Source: PGR: MBA and STRATMOR Peer Group Roundtable Program, 2021.
One factor to consider is that EMBs are more likely to have DBA structures, and to maintain the DBA as they move from lender to lender over a period of years. While mortgage loan originators are not known for their loyalty to the lender parent, in many ways an EMB is built to be portable. When an EMB leaves a company, the branch manager almost always takes the entire branch team and all originators with them. They are recruited into the company as a team or unit, and leave as a unit, and the DBA structure facilitates this portability. Higher turnover may also be a contributing factor to lower productivity, as the higher level of turnover results in a higher percentage of LOs in “ramp up” or “wind down” mode at any given point in time.
Based on PGR data, most lenders operate either a 90-100% EMB model or 90-100% corporate model, and very few operate with a more even split or combination of the two models. Is a mixed model problematic? Do corporate branch managers want to change to an EMB model in good times while EMB managers want to migrate to the corporate model in bad times? Almost every production executive we speak to indicates that a mixed model is not a problem. The selection of the model is primarily dependent on the personality and preferences of the branch manager. A more entrepreneurial and independent-minded branch manager with experience operating an EMB will likely want to keep that structure. Also, lenders that focus on the EMB model have built up a core competence in the model over a period of years and recruiting, marketing, risk management and branch support are fully aligned to support the model.
On a side note, in our M&A practice, which is currently very active, we have buy-side clients that are either not comfortable with the EMB model and/or believe that it is not compatible with their current model. Therefore, as early as possible in M&A discussions, we vet branch model compatibility between the parties.
While banks rarely operate EMBs, it is very common for IMBs — with one out of three loans originated in the retail channel coming from EMB model companies. EMBs operate just like corporate branches in most respects, with the fundamental difference being the way branch managers are compensated. EMB model companies have a “higher cost, higher revenue” model focused more on value and service, and less on price. Therefore, there are fewer transactions per branch and LO, but higher revenue per transaction. But, in the end, EMB profitability and gross margin is almost identical to corporate branch model companies.
Best-in-class EMB operators maintain that this structure is an effective way to scale more quickly with branch centric recruiting, and this appears to be true for many as EMB market share appears to be growing. But easy come, easy go, as EMBs often operate as DBAs and come as a group and leave as a group, which creates slightly higher than average turnover.
By and large, the choice of model is primarily driven by company culture, management preferences and core competencies. The EMB model is not “better” than the corporate branch model — it is all in the execution of the lender’s chosen model.
Choosing the right model for your company, albeit, EMB, corporate, or hybrid, is a strategic decision that requires analysis and planning. STRATMOR has extensive experience in this regard and can assist our lender clients in making the right branch strategy decisions and then execute accordingly. Jim Cameron
STRATMOR works with bank-owned, independent and credit union mortgage lenders, and their industry vendors, on strategies to solve complex challenges, streamline operations, improve profitability and accelerate growth. To discuss your mortgage business needs, please Contact Us.


Feel free to reach out with any questions or needs we might be able to help with.