What a ride the last two years have been in the mortgage industry!
With between 40 and 60 consulting engagements and multiple STRATMOR-sponsored, recurring workshops in process, my colleagues and I have unique access to data and insights that enable us to comment on the state of the industry as we continue into 2022.
In this article, we will share our thoughts on where we are in the current cycle, including recent data on application to closing cycle times, staffing and appraisal wait times. We will also share our perspectives on technology and customer experience, including the use of Robotic Process Automation (RPA), hybrid eClosings and lender perspectives on Loan Origination Systems (LOS) and journey mapping. Finally, we will wrap up with a discussion of the mortgage industry’s long-running conundrum: the “too busy vs. too poor” syndrome.
I hate to be Captain Obvious, but let’s get this out of the way: Refinance volumes are down significantly as interest rates have risen. This recent Mortgage Bankers Association (MBA) “Chart of the Week” showing the purchase and refinance indices from January 2020 through January 2022 paints a clear picture.
Chart 1: MBA Chart of the Week on Mortgage Applications Since 2020
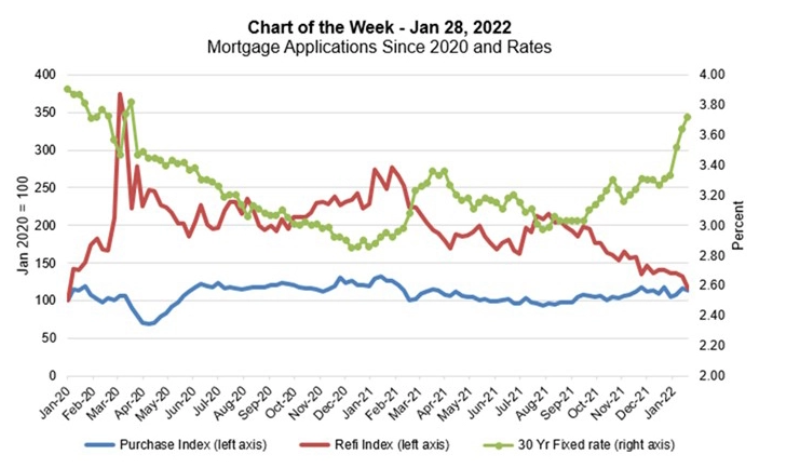 Source: © Mortgage Bankers Association. MBA Weekly Application Survey, January 2022.
 As 30-year fixed rates have risen to over 3.8%, refinance applications have declined to two-year lows. Purchase applications have been steady but not spectacular, constrained by the limited inventory of homes for sale and affordability issues as home prices have skyrocketed. The MBA’s Quarterly Performance Report data below summarizes recent revenue, cost and volume trends.
Chart 2: Revenue Cost and Volume Trends
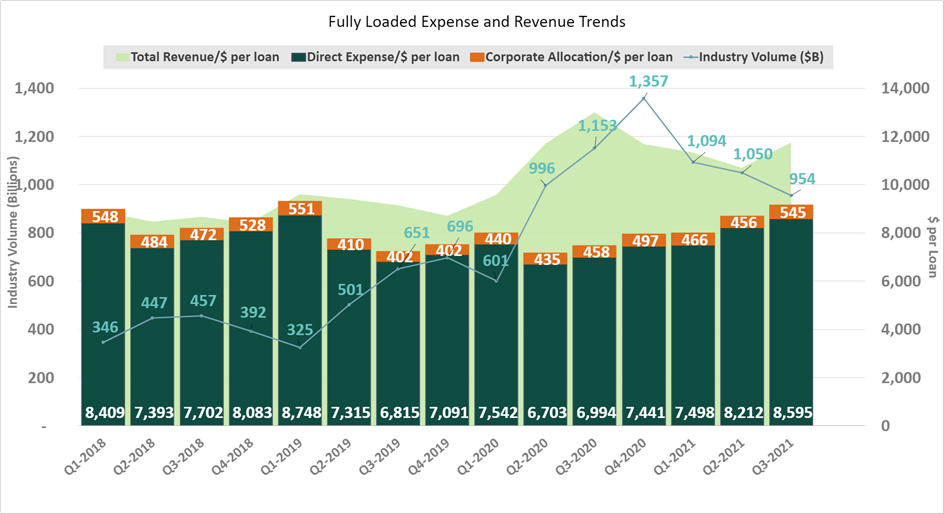 Source: © MBA Quaterly Performance Report Q3-21. www.mba.org/performancereport.
While 2021 turned out to be a very good year by historical standards, the trend lines are troubling.
We are in the beginning stages of a classic down cycle: Volumes are down, revenue is declining and cost per loan is going up as lenders are spreading their fixed cost base over a shrinking number of loan units.
To pile on, it costs more to originate a purchase loan than a refinance due to a variety of factors. including:
My colleague Garth Graham, Senior Partner, has written extensively on pivot to purchase in his article, “Prepare Now for the Storms Ahead: Build Your Purchase Business.” His points are well taken.
Ok, enough on that. We know it is tough sledding out there. But what are lenders seeing and feeling as the market begins the long-awaited down cycle?
Survey responses from lenders participating in our Operations Workshops show that refinance cycle times have steadily declined over the past year and a half:
Chart 3: Refinance Cycle Times
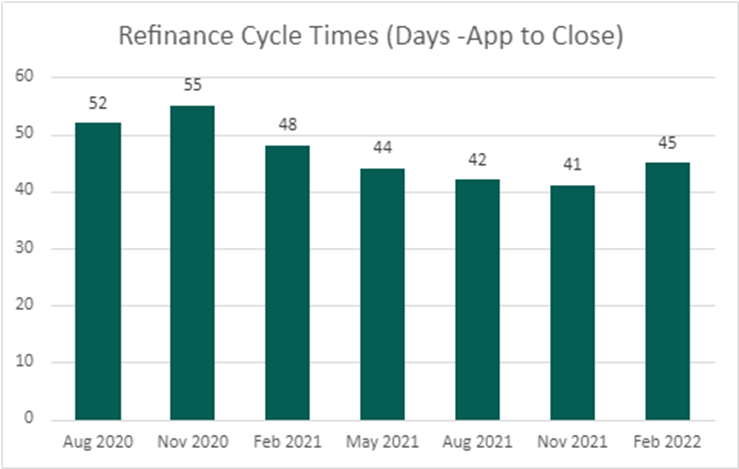 © 2022 STRATMOR Group. STRATMOR Group Operations Workshops.
While purchase cycle times generally fall in the range of 45 days for non-builder transactions, refinance cycle times flex up and down based upon lender capacity. As the industry booked record origination volumes in 2020 and 2021, lenders steadily increased staff. While purchase cycle times held steady, refinance cycle times dropped as staffing “caught up” with volumes in Q3 2021. Now that cycle times are largely under control and pipelines are dropping, more and more lenders are beginning to cut staff.
Data from the Bureau of Labor Statistics indicate that nonbank mortgage banker and broker payrolls increased significantly from 2020 through April 2021 and have bounced around but generally increased from May through December 2021. This is not a big surprise as volumes were strong in 2020 and 2021 and increased staffing was needed to work through large and growing pipelines.
Data collected from the STRATMOR Operations Workshops in February 2022 paint an updated picture of what is happening with staffing levels. In our workshops, we asked operations executives the following question: What best describes your current staffing situation for processing, underwriting and closing?
The chart below summarizes the percentage of lenders that were reducing staff either via attrition or outright staff reductions.
Chart 4: Staff Reductions — Processing, Underwriting and Closing
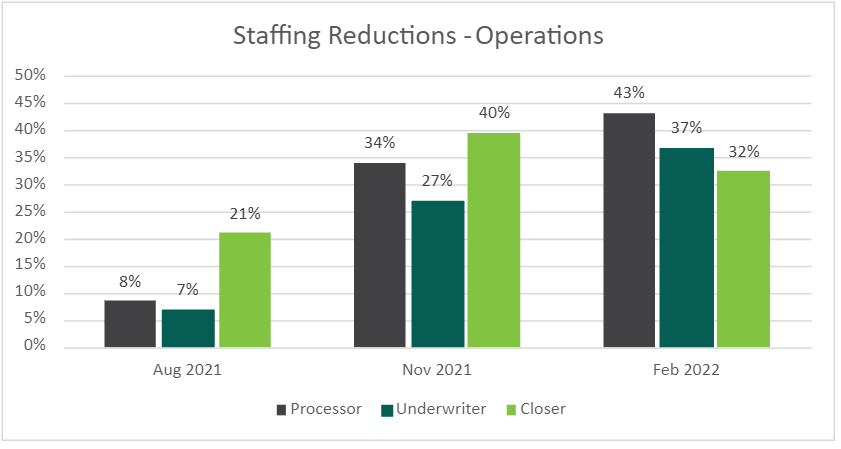 © 2022 STRATMOR Group. STRATMOR Group Operations Workshops.
In processing and underwriting, less than 10% of lenders indicated that they were reducing staff in August 2021, but things changed dramatically by February 2022, as the percentage of lenders reducing staff increased to 43% and 37%, respectively. In the closing area, 21% of lenders had indicated that they were reducing staff in August 2021, with 40% reducing staff in November 2021 and 32% reducing staff in February 2022. It appears that staff reductions started earlier in the closing function and have eased somewhat in February as lenders continue to manage capacity.
The great hiring binge of 2020 and 2021 has ended, and lenders have clearly begun to reduce staff either directly or via attrition as we begin 2022. Looking ahead, we are going to see mortgage banking production headcounts decline throughout 2022 and into 2023, with large variations from lender to lender based on their purchase versus refinance mix of business.
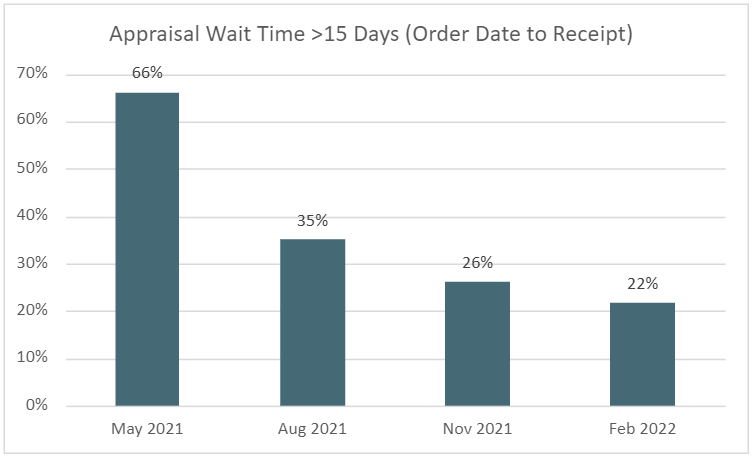
Appraisal turn times have been a nightmare for operations executives, as incredible volumes in 2020 and 2021 highlighted the fact that there is a shortage of appraisers serving our industry. But as bad as it has been, mortgage operations executives are seeing turn times finally beginning to decline after a two-year slog. In STRATMOR’s recent Operations Workshops, we asked lenders for their estimated average wait time for appraisals from order date until receipt. The chart below shows the percentage of lenders indicating average wait times over 15 days.
Chart 5: Appraisal Wait Time > 15 Days
 © 2022 STRATMOR Group. STRATMOR Group Operations Workshops.
Wait times have clearly improved since May 2021, the first time that we asked the question in an Operations Workshop. While reduced wait times are a good thing, there is still significant pain being felt by operations executives in the appraisal area, from what we’ve heard:
Recap: Where Are We in the Cycle?
As the industry experienced record volumes in 2020 and 2021, lenders went on a hiring binge, doing everything they could to get loans closed within a reasonable period. In the third quarter of 2021, most lenders believed their staffing levels were “about right.” In the fourth quarter of 2021, lenders began to trim staff mostly through attrition. As rates increased later in 2021 and in early 2022, staff reductions accelerated. Meanwhile, despite ongoing acute pain in the appraisal area, turn times have been reduced.
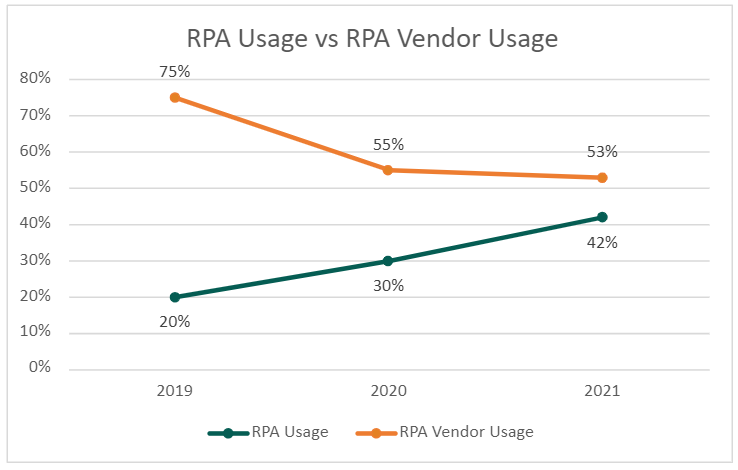
Over the past several years, lenders have begun to use Robotic Process Automation (RPA) or robots (bots) to automatically execute certain tasks in the mortgage process that a human would otherwise perform. The use of RPA has been rapidly increasing in the mortgage industry, even as the percentage of lenders using a third-party vendor to assist with building and managing RPA is on the decline as shown below. This data is from STRATMOR’s lender-only Technology Insight® Study (TIS) results. We’ve conducted this survey since 2014, and the 2021 study included more than 250 lender respondents in three areas: systems, LOS functionality and digital innovations.
Chart 6: RPA Usage vs. Vendor Usage
 © 2021 STRATMOR Group. STRATMOR Group Technology Insight® Study.
While the percentage of lenders using bots increased from 20% in 2019 to 42% in 2021, vendor usage has dropped from 75% to 53% during that same time. Consistent with the increased deployment of RPA, the investment in RPA is growing as well.
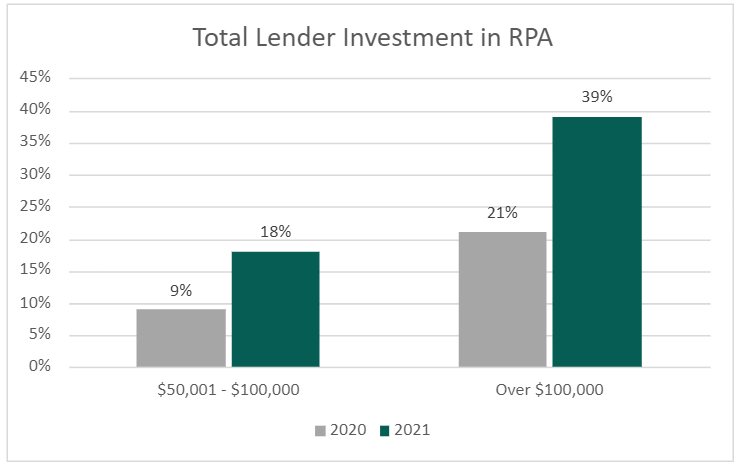
Chart 7: Total Investment in RPA
 © 2021 STRATMOR Group. STRATMOR Group Technology Insight® Study.
In the TIS, we asked lenders to estimate their annual investment in RPA in dollar ranges. The data shows that the percentage of lenders investing between $50,000 and $100,000 and over $100,000 roughly doubled from 2020 to 2021.
Clearly, RPA usage is growing significantly in our industry. Lenders typically use a third-party vendor as they get their feet wet with RPA but tend to use vendors less and less as they develop in-house expertise, and their investment grows. In our Operations and Technology Workshops, executives reinforced the notion that it is important to start with a few simple bots that can be easily implemented, in the spirit of “crawl, walk, run.” Get a few wins under your belt and go from there. Also, while bots appear to provide good ROI, they do break, especially when vendors update their systems with field changes and locations.
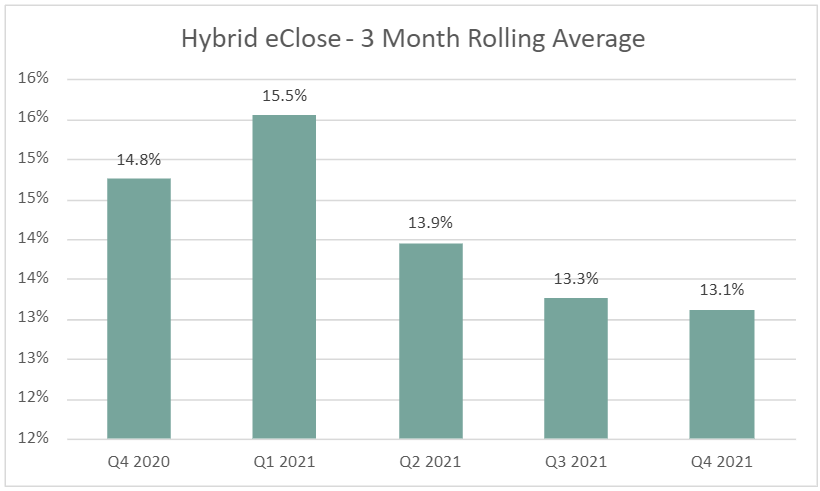
During each quarterly workshop, we ask lenders “What percentage of your loans closed as a hybrid eClosing (includes a combination of electronic and wet-signed documents)?” The chart below summarizes a rolling average of results by quarter since Q4 2020.
Chart 8: Hybrid eClose Rolling Average
 © 2022 STRATMOR Group. STRATMOR Group Operations Workshops.
The results show that, in the aggregate, lenders have not made any real progress in rolling out hybrid eClose transactions since late 2020. In fact, hybrid eClosings for workshop attendees have declined slightly since Q1 2021. But the aggregate data does not tell the whole story. The chart below shows the distribution of hybrid eClosing percentages by lender for Q4 2021.
Chart 9: Percentage of Loans Closed as Hybrid
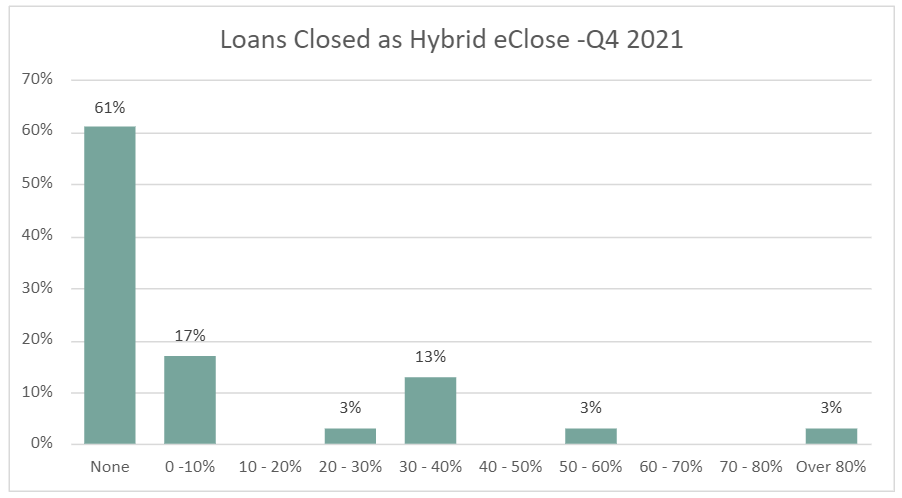 © 2022 STRATMOR Group. STRATMOR Group February 2022 Operations Workshop.
Amazingly, 61% of the lenders did not book any hybrid eClosings in Q4 2021. At the same time, 19% of the lenders closed over 30% of their transactions as hybrids, with a few lenders over the 50% mark.
But lenders that have not closed any hybrid transactions have high expectations for 2022.
Chart 10: Plans to Close Hybrids in 2022
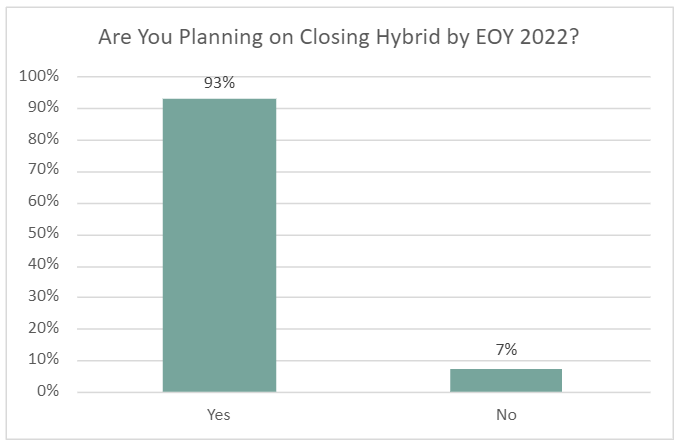 © 2022 STRATMOR Group. STRATMOR Group February 2022 Operations Workshop.
While lenders have good intentions with respect to hybrids this year, the question is, will they be able to execute? That is, will lenders be able to take some of their profits and build out their hybrid capability before the market deteriorates in 2022? More on that in the “Too Busy vs. Too Poor” section below.
Why haven’t lenders been able to increase their use of hybrid eClosings? The polling question below provides some clues.
Chart 11: Biggest Challenges in Rolling out Hybrid eClosings?
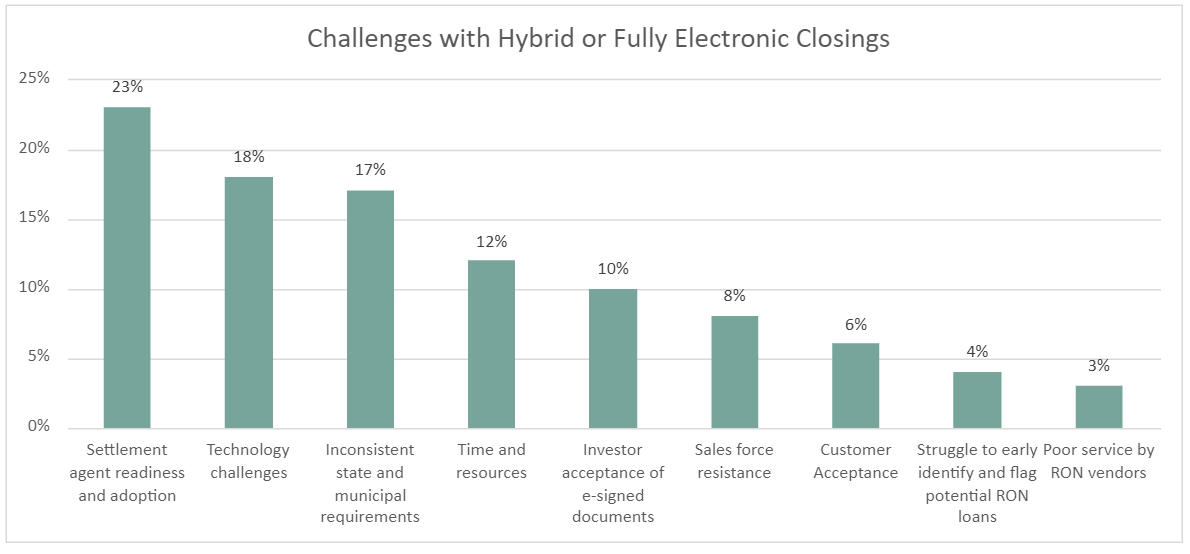 © 2022 STRATMOR Group. STRATMOR Group February 2022 Operations Workshop.
In our experience and our discussions with operations executives, some of the keys to overcoming the challenges in rolling out hybrids include the following:
It is hard to imagine that mortgage closings won’t be fully digital in the next decade. But for the time being, the pace of growth in hybrid eClosings appears to have waned.
In our Operations Workshops, one of the major topics of discussion is around the pain associated with POS or LOS implementations. It’s never easy. A successful implementation (i.e., on time, on budget, believable ROI) requires planning, management discipline, good communication skills, and an incredible amount of perseverance. It seems like every lender has a war story or two about the trials and tribulations around this process, including stories about vendors overpromising, under delivering, not communicating, and in some cases, simply dropping the ball. In our Technology Workshop held in January 2022, we asked lenders, “What percentage of POS/LOS implementation problems are caused by vendors as opposed to lenders?”
Chart 12: Percentage of Implementation Problems Caused by Vendors vs. Lenders
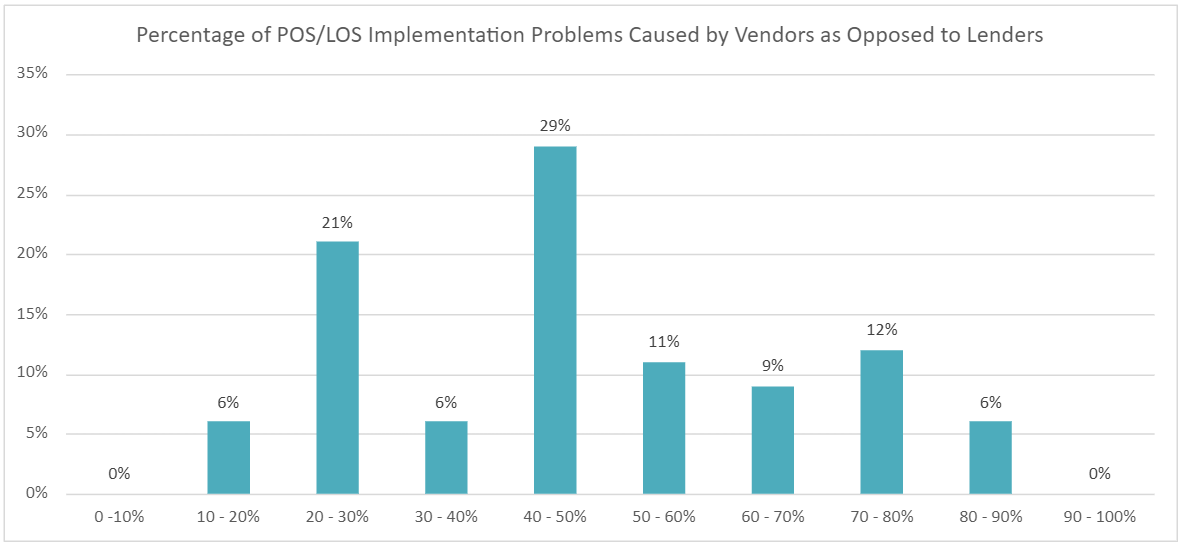 © 2022 STRATMOR Group. January 2022 Technology Workshop.
 The results show that lenders believe that approximately 60% of the problems are caused by lenders and 40% are caused by vendors. While it is easy to point a finger at the vendor when things go wrong, most lenders seem to have a balanced view — there is plenty of blame to go around. For example, lenders may stumble when it comes to:
Sure, vendors make mistakes and have been known to overpromise and under deliver, but on balance, lenders seem to acknowledge the role they play in POS/LOS implementation problems.
In all our workshops, but particularly in our Operations and Technology Workshops, we get an earful around the pain and frustration in dealing with LOS-related problems. To further understand the mindset of mortgage executives, we asked the following question:
Chart 13: If it Wasn’t So Painful, Would You Consider Switching LOS?
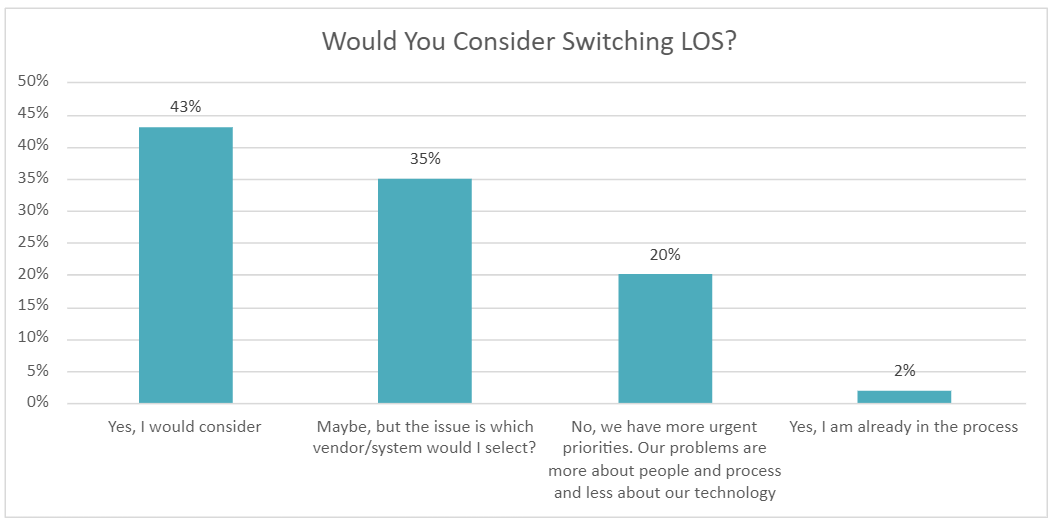 © 2022 STRATMOR Group. STRATMOR Group Operations Workshops.
An astounding 80% of lenders indicated that they would consider switching their LOS if it was not so painful. Importantly, 35% indicated “maybe” but wondered which vendor would represent an improvement over their incumbent system. Mortgage executives seem to recognize that there is no “silver bullet” solution, which is consistent with the survey response above where over 60% of lenders believed that LOS problems are lender-created versus vendor-created. Importantly, our question was phrased with the caveat, “If it wasn’t so painful.” In the real world, we can’t assume that away — the LOS selection and implementation process is always a difficult process and switching costs are high. But still, it is amazing that 80% of lenders have some level of dissatisfaction with their LOS — that is a lot of angst, and it comes through loud and clear in our workshop discussions.
In a recent Operations Workshop, we discussed the concept of “journey mapping” at length. Journey mapping is the process of documenting the mortgage experience from the perspective of the borrower, referral partner or employee. The key element is to document what the borrower is thinking and feeling during each step along the way. This is quite different from documenting process flows from the perspective of the lender to make the “mortgage factory” as efficient as possible. What good does it do to make the mortgage process efficient while the customer is not having a delightful experience?
To set the stage for our discussion, we asked the following question:
Chart 14: Have You Ever Done Journey Mapping?
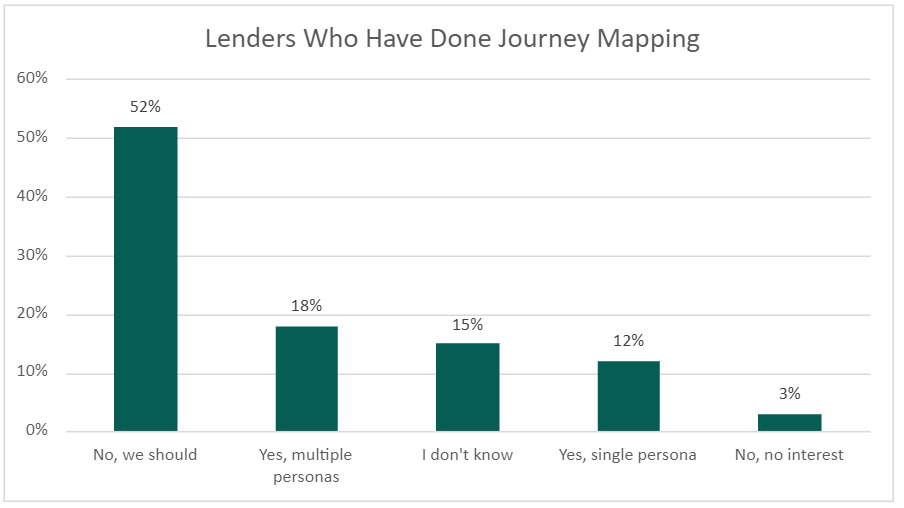 © 2022 STRATMOR Group. STRATMOR Group February 2022 Operations Workshop.
Amazingly, only 30% of respondents answered “yes” with 70% answering “no” or “I don’t know.” While operations and servicing executives are typically focused on efficiency, productivity, and cost to originate or service, it is easy to forget that there is a customer or referral source involved in the transaction or interaction. Lenders, referral sources and employees share the same goal: delighting the customer and getting them into a new home.
For more on journey mapping, contact our Customer Experience Director Mike Seminari, and be sure to read the article co-authored by Mike and STRATMOR Senior Advisor Sue Woodard, “Mapping the Evolving Customer Journey” in our December Insights Report.
Here is the question for the 70% of lenders that do not create journey maps: Will you have the discipline to find the time to make this happen in the middle of an industry downturn?
During the record volumes in 2020 and 2021, many lenders have been in “all hands — on deck” mode and have been simply too busy or too distracted to focus on longer term technology, process and customer experience enhancement projects. At the same time, most lenders have some money in the bank and a much stronger capital position as compared to 2018-2019. Lenders therefore have an opportunity to act now before the red ink starts flowing and a “siege mentality” starts to creep in. The graph below depicts the theoretical window of opportunity for the mortgage industry.
Chart 15: Window of Opportunity – Too Busy vs. Too Poor
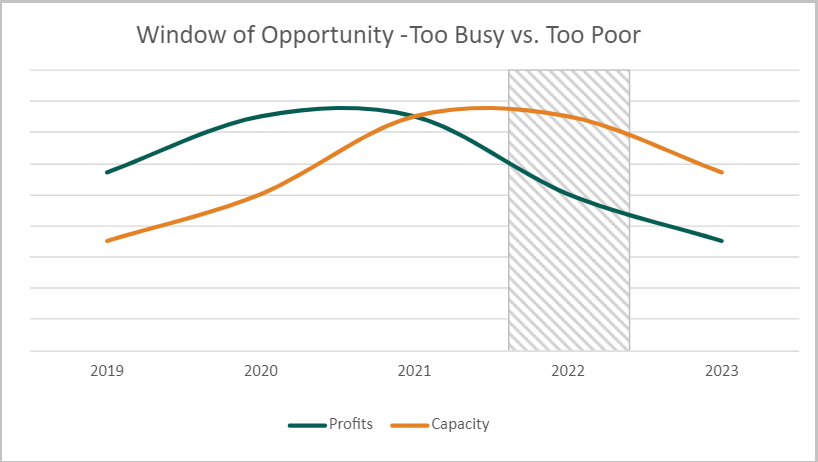 © 2022 STRATMOR Group. STRATMOR Conceptual Diagram.
 As we moved from 2019 to 2020, profits increased dramatically. Meanwhile, most lenders were chronically short staffed and were operating at more than 100% of capacity. Lenders could not hire fast enough, cycle times ballooned out, and senior management just wanted to ensure that they could close loans in a semi-reasonable timeframe compared with their peers. As a result, in 2020 and early 2021, lenders had limited staffing available to tackle large scale projects.
This began to change around Q3 2021, when most lenders indicated that staffing was “about right.” Now, in Q1 2022, lenders are reducing staff, but for the time being, they still have ample liquidity and capital to invest. Lenders are now in a window of opportunity when they are not too busy, and not too poor — but how long will it last? How long will lenders have the stomach to make big investments in the face of volume declines and acute profit pressures?
After many years of observing this industry and consulting with mortgage lenders, there are certain clear indicators of a classic down cycle. We are seeing those signs now and have described some of them in this report, namely:
The good news is that many lenders are seeing these signs as well and reporting back to us that they realize changes will be required to succeed as we move through this part of the cycle. While many admit that they should be considering new technologies now and have seen success with RPA and other new tools, there is still resistance.
Lenders that take advantage of this window of opportunity, when they have both the time to choose and implement new technologies and the cash to do so, will lead through this downturn and emerge as stronger competitors when the next upturn arrives. Making good choices will require them to fully understand the needs of their borrowers and invest in technologies that will deliver high levels of borrower satisfaction.
If you’re considering your strategies for the market down cycle, we would welcome the opportunity to visit with you to discuss how STRATMOR Group can support you in 2022. Jim Cameron
STRATMOR works with bank-owned, independent and credit union mortgage lenders, and their industry vendors, on strategies to solve complex challenges, streamline operations, improve profitability and accelerate growth. To discuss your mortgage business needs, please Contact Us.


Feel free to reach out with any questions or needs we might be able to help with.