At STRATMOR, we work with clients on a wide variety of consulting engagements. We hear firsthand how executives are coping with the current challenging market, and we work with them to execute strategies and tactics to navigate through the crisis. While most senior executives have managed their way through multiple downturns in the mortgage business, the universal sentiment is that “this one feels different.” That’s because it IS different!
This article explores the ways in which the current market downturn differs from past cycles. It’s quite true — as down cycles go this is a bad one. But it’s not all doom and gloom — there is some light at the end of the tunnel and there are some positive aspects to this cycle, which we will highlight in the second half of the article.
When considering what’s different about the current market downturn, the logical place to start is to examine the historical trend of mortgage interest rates, using the 30-year fixed rate as the benchmark.
Chart 1
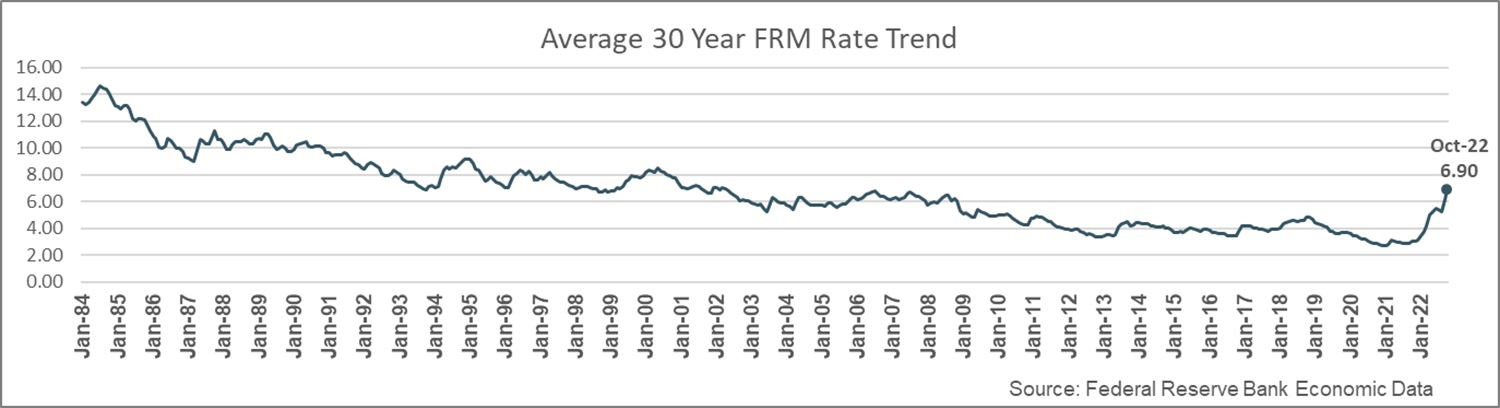
Chart 1 above summarizes Federal Reserve Economic Data (FRED) provided by the Federal Reserve Bank of St. Louis. It captures the 38-year annual trend for mortgage interest rates gleaned from monthly FRED data beginning in 1984. A cursory review of the shape of the trend line reveals the spike in rates which occurred in 2022. While there were other notable increases in rates in 1987, 1994, 1999, 2013 and 2017-2018, the increase in 2022 appears to be the fastest and steepest.
To drive this point home, using the underlying monthly data, STRATMOR summarized the top ten monthly increases in absolute terms below.
Chart 2
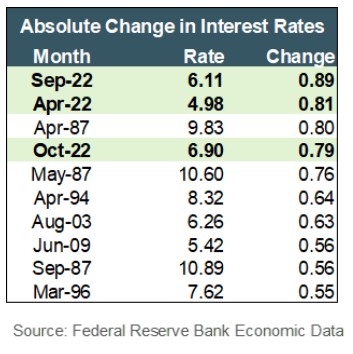
Amazingly, three of the top five monthly increases (noted in the green lines) occurred during the first 10 months of 2022. That’s three of the top five monthly increases in rates over 37 years and 10 months, a 454-month timeframe!
Chart 3 below summarizes the top ten monthly increases in rates since 1984 on a percentage basis.
Chart 3
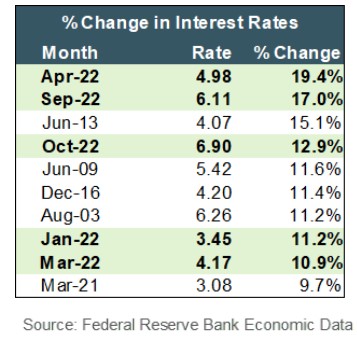
On a percentage basis, five of the top ten highest monthly increases occurred in 2022. So, when considering the severity of the interest rate increases, both in absolute and percentage terms, the biggest increases in modern history occurred in 2022.
In addition to the severity of the rate increase, we also need to consider the speed with which rates increased. One can “eyeball” the interest rate trend line shown in Chart 1 above and clearly see the speed of the rate increase. The speed of the increase is also captured in Chart 2, as three of the top five monthly increases in rates occurred in 2022. 1987 was a rough year, too, with two months in the top ten, while no other year had more than one month in the top ten. Likewise, as shown in Chart 3, five of the top ten percentage increases in rates occurred in the first ten months of 2022, while no other year had more than one month in the top ten.
Consistent with the speed and severity of the increase in rates, mortgage origination volumes have plummeted fast. The chart below captures historical and 2022 forecasted volumes provided by the Mortgage Bankers Association (MBA).
Chart 4
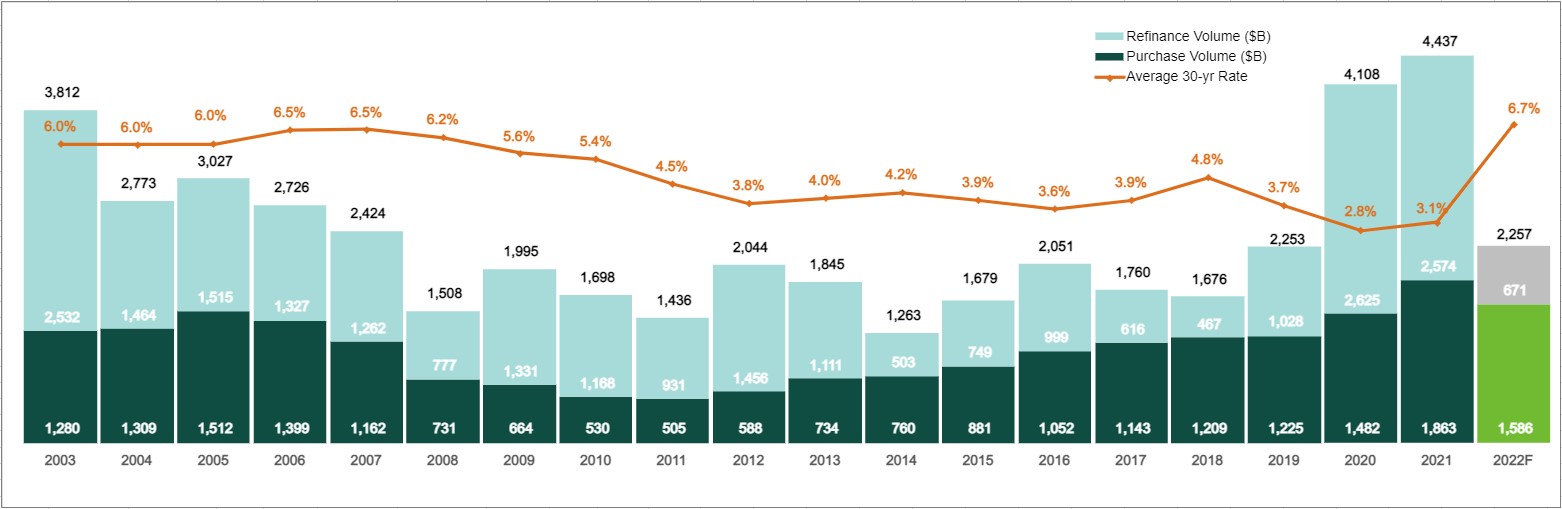 Source: Mortgage Bankers Association October 2022 Forecast.
 Similar to the interest rate trend in Chart 1, one can “eyeball” the volume chart above and see the speed and severity of the drop in forecasted mortgage origination volumes for 2022. While the chart above begins with 2003, STRATMOR analyzed industry volumes going back to 1990. While we experienced significant volume declines in 1994 (not shown above), 2004, 2008, 2014 and 2017-2018, the drop in 2022 appears to dwarf them all. To further highlight the magnitude of the drop in 2022, STRATMOR summarized the top five biggest decreases in annual actual/forecasted volumes since 1990 below.
Chart 5
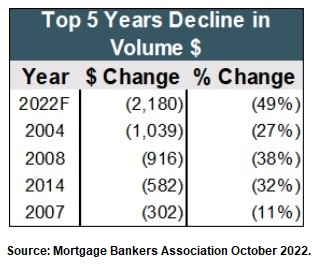
Not surprisingly, 2022 forecasted volumes are expected to drop by $2.18 trillion which would be the largest dollar volume decline in history — by far.
Chart 6 below summarizes the top five largest percentage declines in mortgage origination volume since 1990.
Chart 6
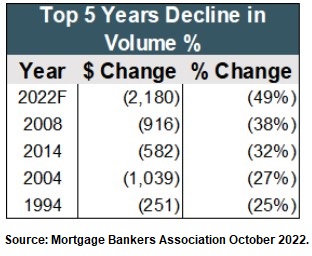
At 49%, the forecasted drop in 2022 would be the largest percentage decline in year over year (YoY) volume since 1990. It is clear to see that we are headed to the largest annual volume decline in history in 2022, both in absolute dollar and percentage terms.
While the drop in dollar volumes is bad enough, the drop in unit volume is even worse. As strong home price appreciation has driven average loan sizes to record highs, this has tended to mask the underlying change in unit volumes. The chart below summarizes actual and forecasted industry volume in both dollars and units from the MBA.
Chart 7
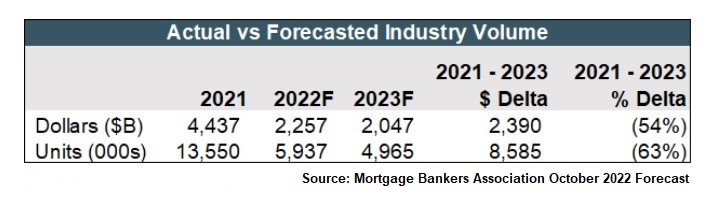
The drop in dollar volume from 2021 to 2023 is projected to be $2.39T or 54%. However, the drop in units is forecasted to be 8.5M or 63%, which is a staggering decline. If the 2023 forecast holds, that would mean that about two-thirds of the unit volume will have disappeared over a two-year period. While the dollar drop in volume garners more headlines, the drop in unit volume is the key driver of the massive amount of excess operational capacity that exists in our industry today.
While margins compress during every mortgage downturn as more lenders are chasing fewer loans, the speed and severity of this downturn has created revenue/margin compression “on steroids.” Let’s first examine the historical revenue trends in basis points (bps) to measure the severity of the margin compression using data from the MBA and STRATMOR Peer Group Roundtables (PGR) program.
Chart 8
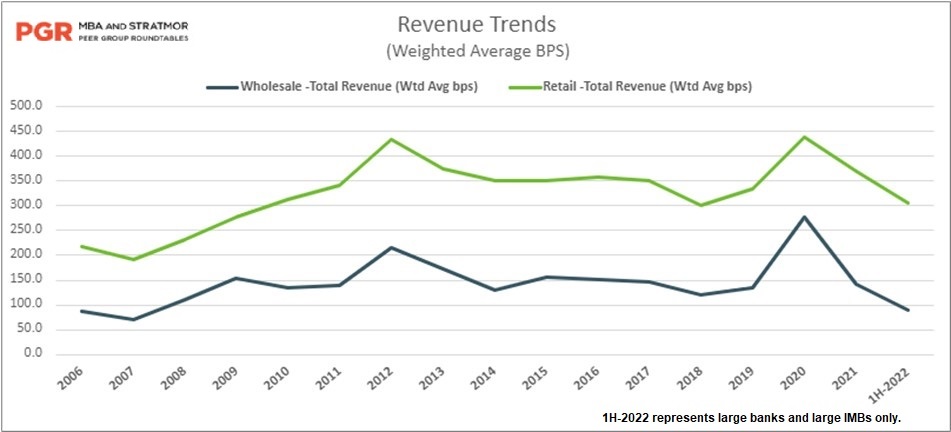
Chart 8 summarizes the weighted average revenue for the retail and wholesale channels for all peer groups since 2006. While revenue dropped from 2012 to 2014 and in 2018, the steepest decline in revenue occurred from 2020 to the first half of 2022. The chart below summarizes the periods in which the largest revenue declines occurred.
Chart 9
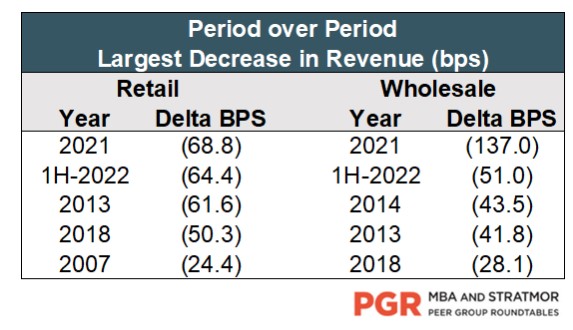
While 2021 was a record year for production volume at $4.4 trillion, we began to see significant margin compression that year, particularly in the second half as lenders were fully staffed and began lowering prices to keep their mortgage operations running efficiently. In the past 15 and a half years, the biggest declines in revenue occurred in 2021 and the first half of 2022 for both the retail and wholesale channels.
Looking at the revenue trend lines in Chart 8 above, one might argue that the drop in revenue was steep in 2021 and the first half of 2022 because revenues had risen so sharply in 2020, and therefore had more room to fall.
To address this question, we compiled the chart below to look at the largest annual percentage decreases in revenue by channel.
Chart 10
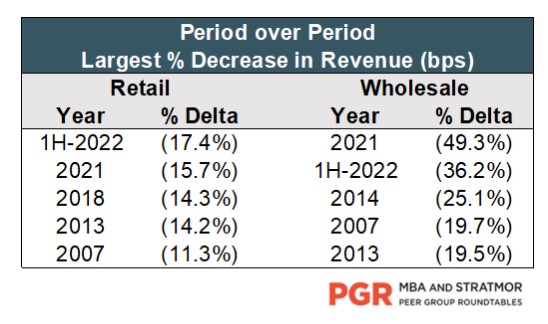
Once again, the largest percentage period-to-period declines occurred in either 2021 or 1H-2022. When the books are closed for full-year 2022, it is highly likely that 2021 and 2022 will maintain their ranking as the largest annual revenue declines, at least since 2006.
Consistent with the increase in rates and declines in production and revenue, we are seeing the largest profit drop in history. Chart 11 below summarizes the Net Production Income/Loss by quarter since 2012 from the MBA’s Quarterly Performance Report (QPR).
Chart 11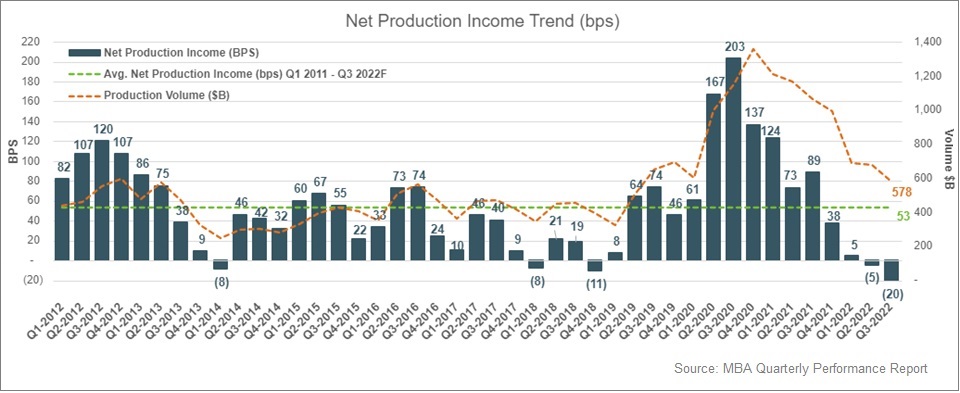
The QPR sample includes approximately 350 lenders comprised mostly of non-banks. While the sample does not include banks and is heavily weighted toward retail lenders, it represents a good proxy for industry profits, at least directionally, from Q1 2012 through Q3 2022. The only comparable downturn we see was in the 2012 to 2014 timeframe. During this timeframe, the “peak to trough” drop from Q3 2012 to Q1 2014 (7 quarters) was 128 bps. In contrast, the peak to trough drop from Q3 2020 to Q1 2022 (7 quarters) was 198 bps. And when we look at the timeframe from Q3 2020 to Q3 2022 (9 quarters), the decline was a massive 223 bps.
We have had the wind at our back for over three decades in mortgage banking, as rates have generally declined from the high teens in the early 1980s to a low of around 2.5% in 2020 (see Chart 1 above). While there have been notable increases in rates over that timeframe (e.g., 1994, 2004, 2008, etc.), the industry has been “bailed out” by subsequent rate decreases and the resultant refinance booms.
How likely is it that rates will decline to 2.5% or less? We will leave that question to economists like Mike Fratantoni at the MBA. But given the current level of rates in the 7% range, the highest level of inflation in 40 years and the Fed’s determination to bring inflation down by raising rates, it does not appear that rates will drop to 2.5% any time soon. While many economists at the MBA and elsewhere believe that we will have a recession in 2023, which would likely cause mortgage rates to decline, economists are generally not expecting a return to the low-rate trough we saw in 2020.
Virtually all lenders we have spoken with are cutting costs and positioning for the next refinance wave. But given the fact that rates bottomed out in 2020, future refinance waves won’t be described as booms, but more likely mini refinance booms or “boomlets.” Lenders should not count on a massive refinance boom to bail them out of their current predicament.
In broad strokes, one can see that the profits earned by lenders in 2020 and 2021 were very large, by historical standards, with historically large production volumes multiplied by historically large production net income in bps. Why does this matter? While banks have always had access to large amounts of liquidity and capital, non-banks are entering the current severe downturn with a sizable war chest of liquidity and capital that will fund their operations for a longer period. Assuming that non-banks have retained a meaningful percentage of profits in their companies (versus distributing those profits to shareholders), this would suggest that the duration of this downturn will be longer than usual. Non-banks have more cash and capital to burn, and thus can absorb losses for a longer period.
But hold that thought because there is a big caveat: non-banks must operate within the constraints of warehouse lender and investor covenants which won’t tolerate an extended period of losses. More on that below.
While the big profits recorded in 2020 and 2021 would argue for a longer duration downturn, we believe there is a stronger argument for a shorter duration.
The first thing to consider is that the non-bank share of mortgage industry production has steadily risen since 2010.
Chart 12
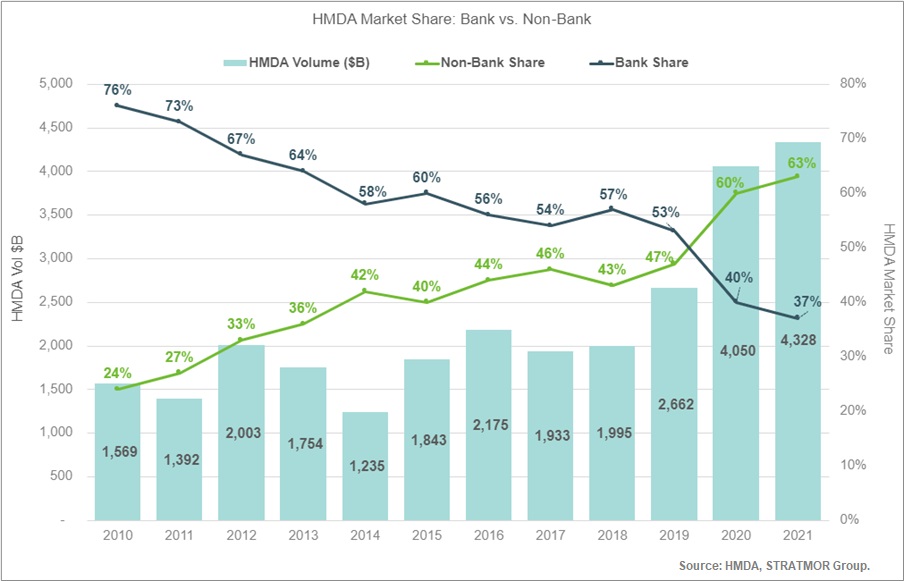
Non-bank share has increased from 24% in 2010 to 63% in 2021, based on HMDA data analyzed by STRATMOR. Why does this matter? Non-bank lenders, particularly Independent Mortgage Bankers (IMBs), are more likely to react quickly to shed staff during a downturn as compared with banks.
The primary reasons for this are:
Recent data from the MBA and STRATMOR Peer Group Roundtables (PGR) program supports the view that non-banks move more quickly to eliminate staff. During the first half of 2022, Large Banks and Large Non-banks reported turnover rates for processors, underwriters and closers. Non-bank annualized turnover rates were typically in the range of 35 to 50% for these positions versus 18-22% for banks.
A couple of factors may partially explain the difference for the first half of 2022. Large banks generally have much longer application-to-closing cycle times than non-banks. Therefore, in the first half of 2022, banks had to keep staff on hand longer in order to work out their bloated pipelines that carried over from 2021. Also, many banks moved mortgage fulfillment employees to other areas of the bank (e.g., home equity), and not all these internal transfers are reflected in the bank turnover data. However, even with those caveats in mind, the data supports the notion that non-banks move more quickly to shed staff, and our experience with our consulting clients fully supports this.
Since non-banks have a much larger share of the origination market and are more likely to move more quickly to reduce capacity, this would suggest that the current downturn may have a shorter duration than past downturns. While it is true that many non-banks entered this downturn with a large war chest of cash and capital, this is more than offset by the impact of warehouse and investor covenants, which are causing lenders to move expeditiously to cut costs. In short, while this downturn is very painful, perhaps we will get through it faster.
The chart below summarizes announced mortgage M&A transactions since 2016.
Chart 13
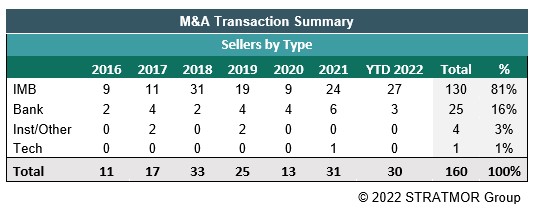
Of the announced transactions since 2016, 81% of the sellers have been non-banks or IMBs. Since non-banks have a larger share of the market as compared to prior down cycles, and are more likely to consolidate, this would argue for a shorter duration downturn. Non-banks cut capacity and consolidate more quickly than banks, and this will likely shorten the duration of the downturn.
There is other good news on the horizon as we consider U.S. population trends.
Chart 14
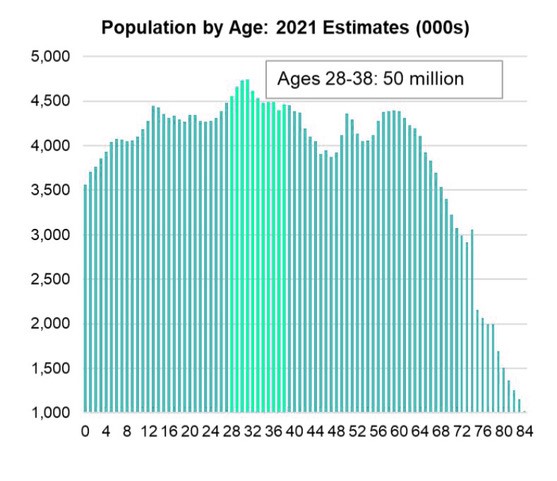 Source: Mortgage Bankers Association, U.S. Census Bureau.
 As we look at data on U.S. population by age, a very large cohort is in the 28 to 38-year-old bucket, which happens to be prime home buying age. This bodes well for the purchase market in the next five to ten years and will spur demand for home purchases. While we continue to see a lack of supply of homes for sale, the hope is that the strong demand by this age demographic will create the impetus for an increase in housing starts and home resales.
The national delinquency rate for first lien mortgages is at an all-time low as shown below.
Chart 15
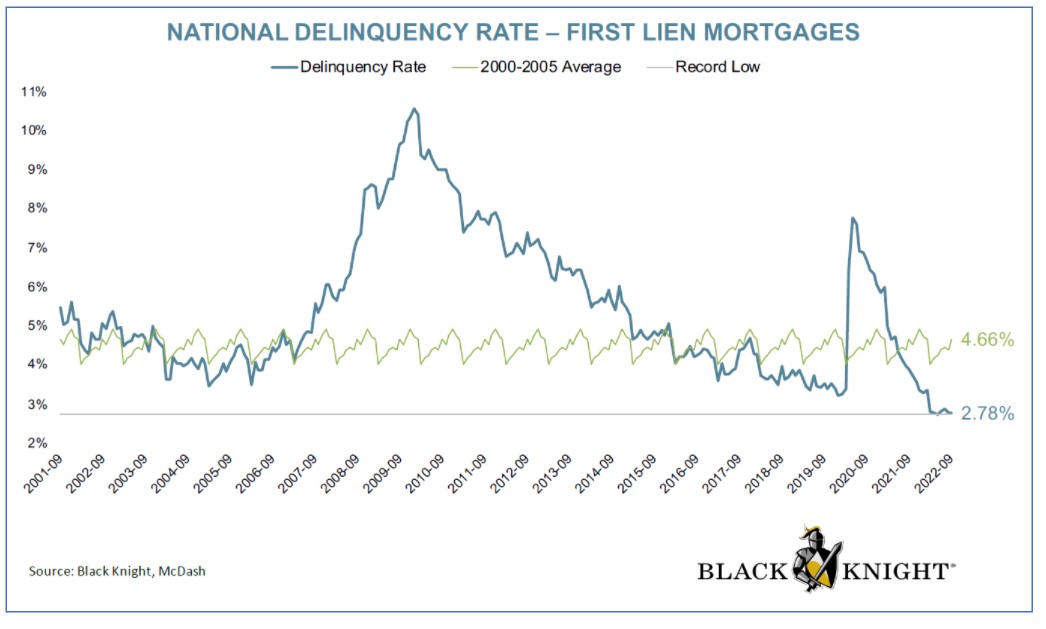
While the mortgage production volumes and profits have cratered, at least those homeowners who have mortgages are making their payments. There is risk that a recession will result in higher delinquencies, but at least we are at record lows for the moment and owners of servicing are seeing strong ongoing cash flows and very low levels of default activity.
Another piece of good news — household net worth has increased nicely since 2009 as shown below.
Chart 16
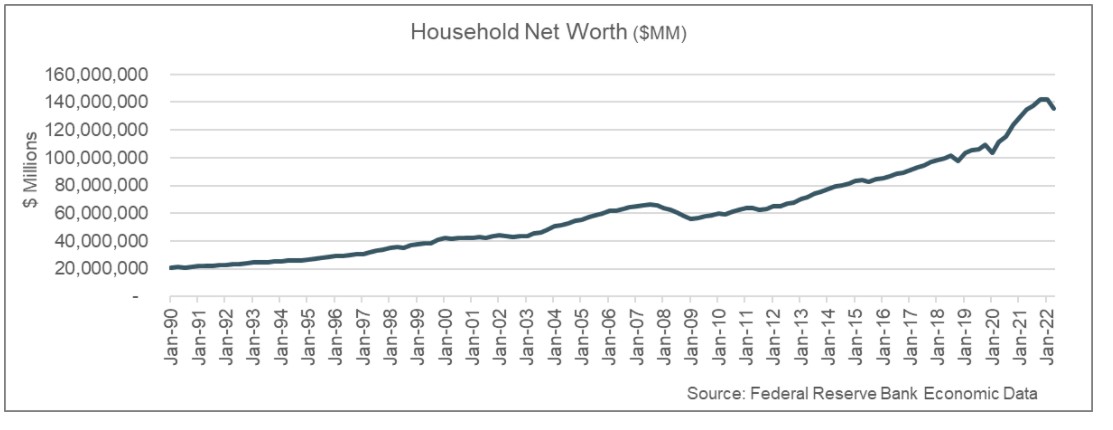
While the mortgage business is under extreme duress, households have a strong financial cushion due to appreciation in home values and a generally favorable stock market. A recession could put a dent in household net worth, but many borrowers and prospective borrowers would go into it with a sizable amount of net worth.
Federal Reserve data on household financial obligations and debt service ratios is shown below.
Chart 17
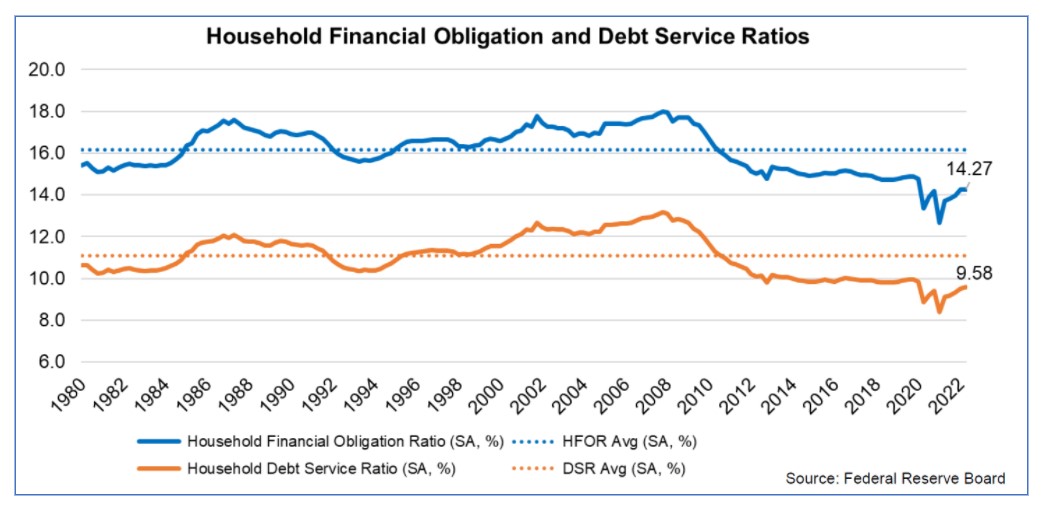
Household financial obligations and debt service ratios are much lower than average in 2022, and certainly much lower than when we entered the Great Recession of 2007 and 2008. This is good news for lenders — as we emerge from this mortgage market downturn, borrowers and prospective borrowers will be in a better position to qualify for mortgages and to make their payments once they close their loans. While the recession risk looms large, at least households are in much better shape with respect to net worth, delinquencies and the ability to meet financial obligations.
Let’s recap what is different about this downturn:
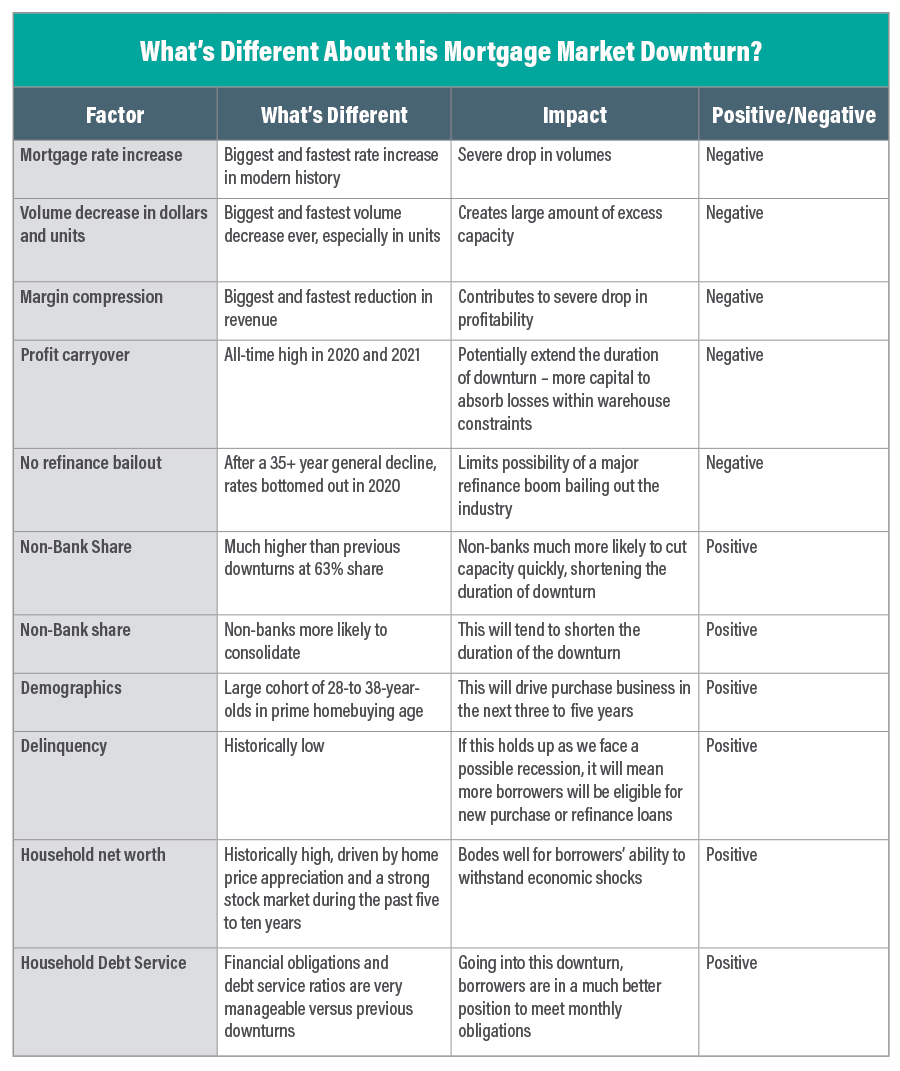 Source: © 2021 STRATMOR Group.
 This may be the most painful downturn in mortgage banking history in terms of the severity of the downturn and the speed with which it occurred. We have an unprecedented amount of excess capacity, and many lenders will need to sell or simply won’t survive.
That’s not to say there is no hope. Absent a major recession, the duration of the downturn may be shorter than past down markets due to the historically high non-bank market share. Also, there are some bright spots with respect to demographics, low delinquencies and healthier than normal household net worth and debt service capability. These factors may help hasten us toward the day when we can return to “normal” with revenue rationalizing, capacity adjusted and a return to profits that are reasonable based on the risks of the business. At least until the next downturn! Cameron
STRATMOR works with bank-owned, independent and credit union mortgage lenders, and their industry vendors, on strategies to solve complex challenges, streamline operations, improve profitability and accelerate growth. To discuss your mortgage business needs, please Contact Us.


Feel free to reach out with any questions or needs we might be able to help with.